May 6'th 2010 Flash Crash Analysis
Continuing Developments
Delays on 04-28-2010
The Effects of "High Frequency
Quoting"
Publication Date: September 2, 2010
Back to Table
Of Contents
|
While scanning through historical data looking for previous days which exhibit
similar behaviour to that of
05/06/2010,
we noticed the following spike in our HFT monitors on 04/28/2010 at
11:27:46:
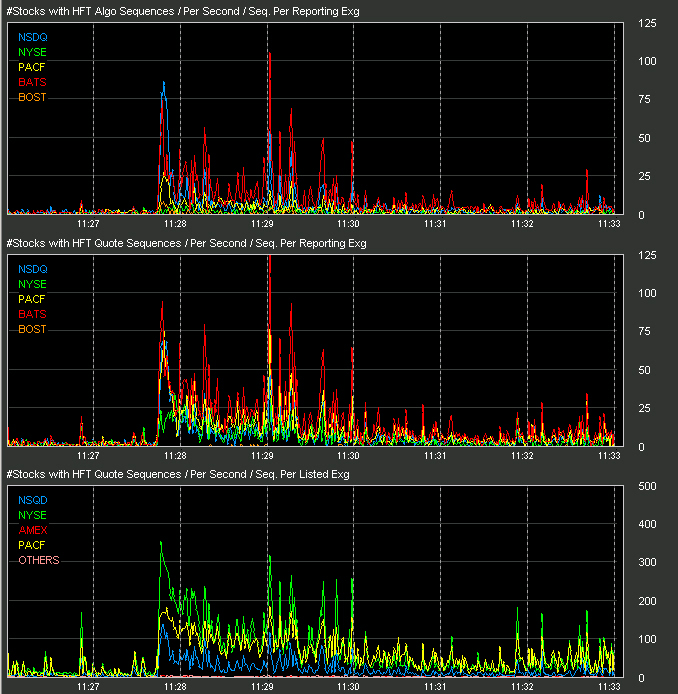
We decided to investigate this further to determine if any stocks experienced
the same delays from the high quote activity that started at 11:27:42 which we
saw on 05/06/2010 and reported on in our initial
Flash
Crash Analysis. We found many.
Note that this was just one week prior to 05/06/2010, the day of the flash
crash. The warning signs were present. |
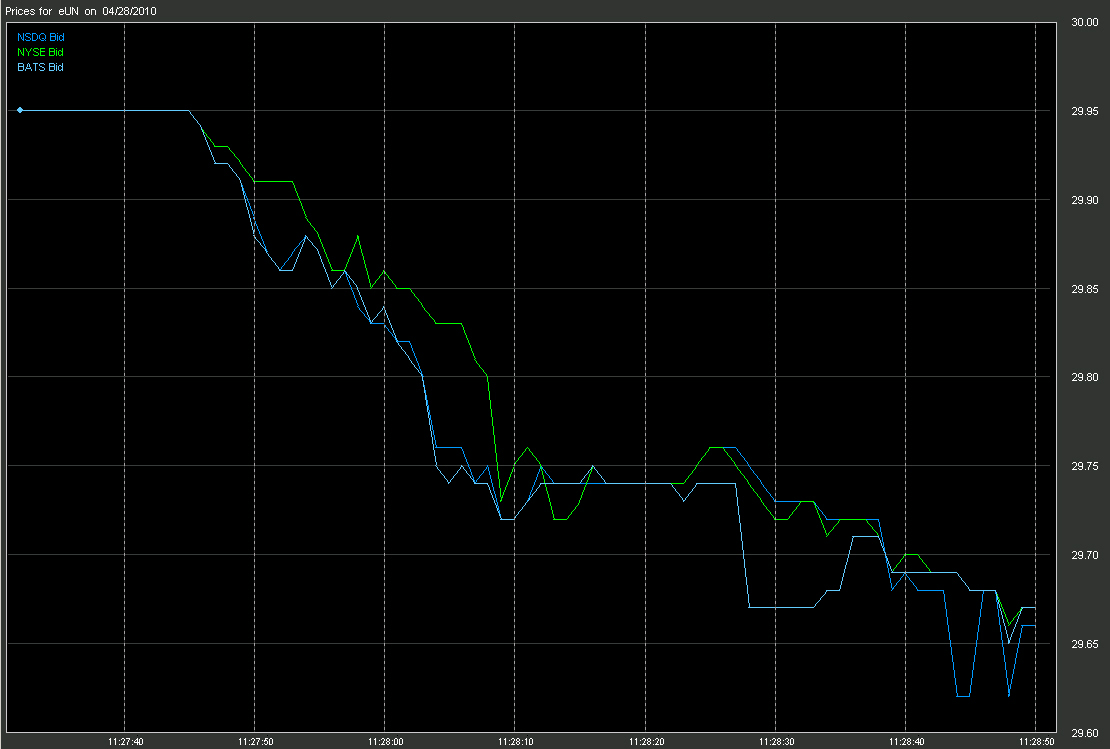
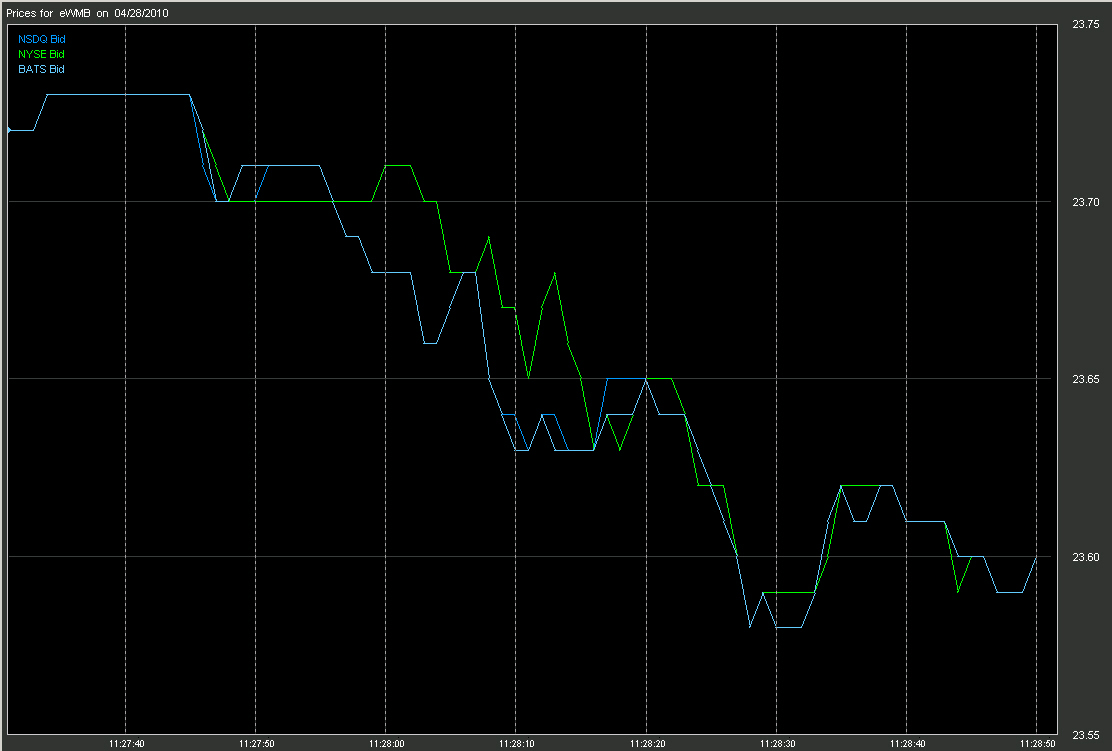
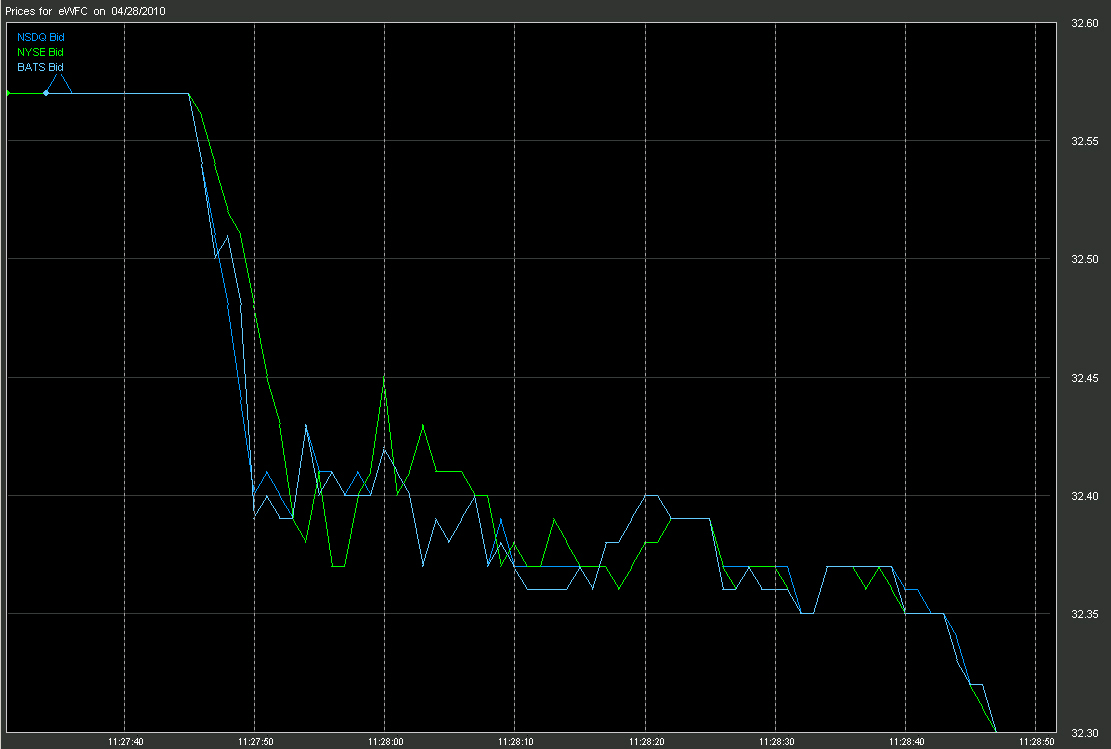
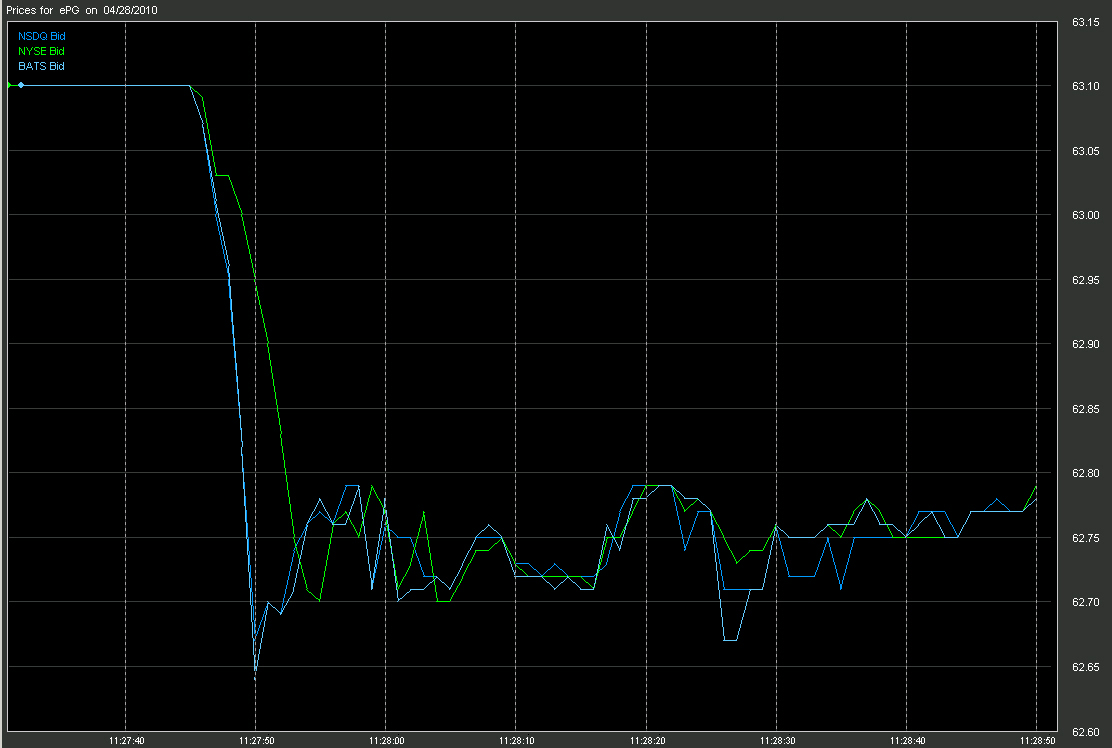
Delays
Seconds after the high quote rates began NYSE quotes began to lag the market.
Here we show four stocks that were found to have delays in the NYSE quotes on
4/28/2010. These four were chosen at random and there are many other not shown
that also experienced the delay.
As we pointed out in our "Latency On
Demand" report, if the average or base quote rate is around
10,000/second, then it only takes an additional 10,000 quotes/second to reach
the magic 20,000 quotes/seconds where a corresponding delay is seen in NYSE
quote from CQS. This 10,000 quotes/second can be in any stock or combination of
stocks that NYSE sends quotes to CQS for.
(click on the smaller charts for a full size image)
|
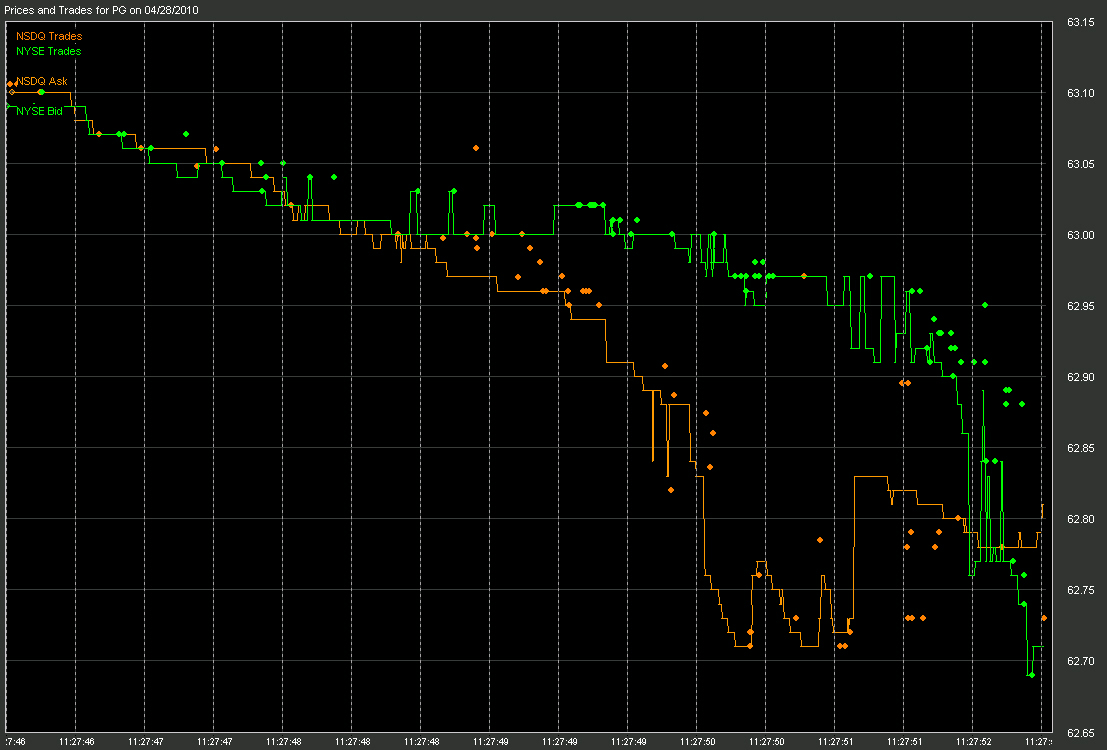
What we demonstrate in this report is this; when the NBBO ask dropped below
the NYSE bid, trade executions are seen from NYSE that equal the NYSE bid and
trade executions from other exchanges at the NBBO ask. This clearly
demonstrates that CQS does indeed influence and drive trading.
For our detailed trade analysis, we decided to focus on PG (Proctor &
Gamble). Note in the chart below the NYSE quotes began to lag the market at
11:27:45 and continued to lag through 11:28:00. |
In the following charts, trades are plotted as a circle,
bid and ask prices as a line.
Here we see trades occuring on the NYSE exchange at the NYSE bid price and on
NASDAQ at the NASDAQ ask price. This is very significant. It shows that
the cross in CQS drives trading.
|
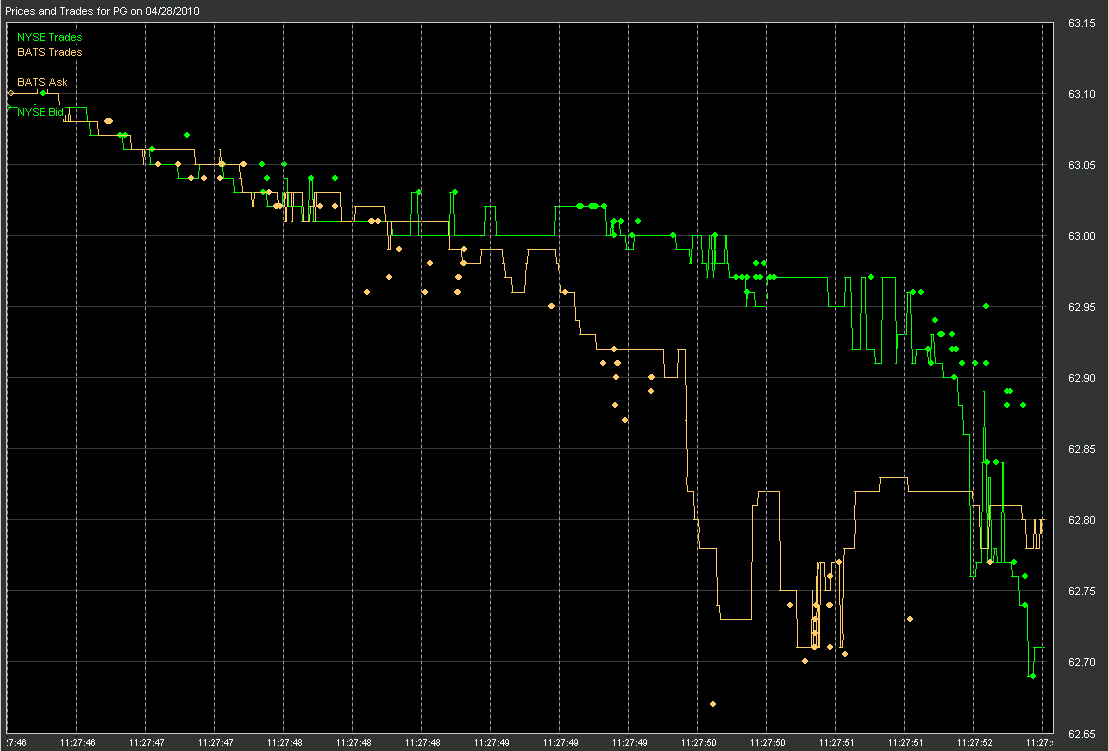
Here again we see trades occuring on the NYSE exchange at the NYSE bid
price and on BATS at the BATS ask price.
|
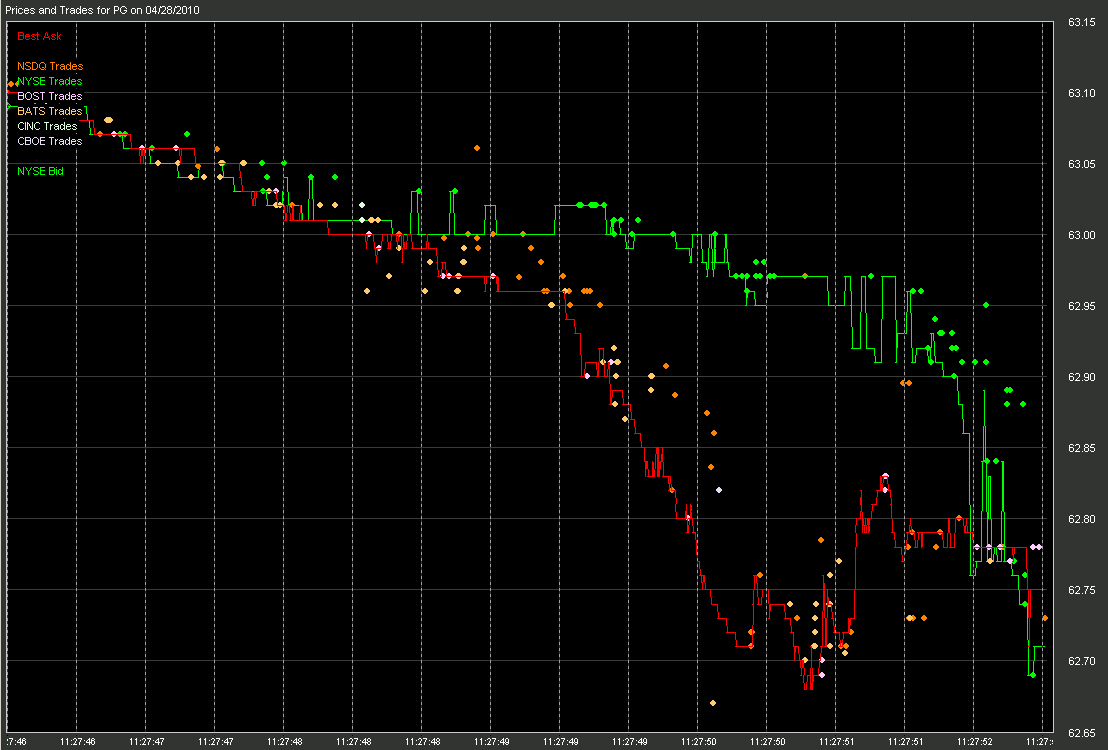
Finally we show the NBBO ask price, the NYSE bid price and trades from
various reporting exchanges. It is easy to determine here that the NYSE price
is lagging and severely crossed with the NBBO ask. As in the previous charts,
trades occured on the NYSE exchange at the NYSE bid price and on other
exchanges near the NBBO ask price.
|
| |
Inquiries: pr@nanex.net
Publication Date: September 2, 2010
http://www.nanex.net
| This report and all material shown on this
website is published by Nanex, LLC and may not be reproduced, disseminated, or
distributed, in part or in whole, by any means, outside of the recipient's
organization without express written authorization from Nanex. It is a
violation of federal copyright law to reproduce all or part of this publication
or its contents by any means. This material does not constitute a solicitation
for the purchase or sale of any securities or investments. The opinions
expressed herein are based on publicly available information and are considered
reliable. However, Nanex makes NO WARRANTIES OR REPRESENTATIONS OF ANY SORT
with respect to this report. Any person using this material does so solely at
their own risk and Nanex and/or its employees shall be under no liability
whatsoever in any respect thereof. |
|
|
|