May 6'th 2010 Flash Crash Analysis
Continuing Developments
Explaining the NProbe Charts
Publication Date: August 23, 2010
Back to Table Of Contents
|
During our investigation of the Flash Crash of May 6'th, 2010 we came across
what appeared to be very unusual bursts of quote traffic. On close examination
these bursts appeared to have patterns contained in the data. However, because
many of the patterns we thought we were seeing happened within the same second
or even millisecond, the question arose of how to visualize these patterns to
determine if in fact they existed as we thought they did.
To chart and visualize the strange sequences we saw, we developed the Price
Sequencer application. The Price Sequencer is designed to analyze large
bursts of trades and quotes (which occur in a short amount of time) for
a single stock and plot them all sequentially regardless of the time-frame. This
helps identify strange and unusual quote or trading patterns, potential quote
stuffing periods and/or detailed, sub-second analysis of trading/quoting
activity. The Price Sequencer can be used in real time or by replaying NxCore
historical tapes.

The Price Sequencer works by capturing every quote and trade sequentially. When
charting data this way, nothing is lost or absorbed into the data due to the
accumulation of data in a given time slice (such as 1 minute bar charts).
Suppose the following sequence of quotes/trades is made:
1) Quote from NSDQ, Bid/Ask/Bidsize/Asksize
2) Quote from BATS, Bid/Ask/BidSize/Asksize
3) Trade from NYSE, Price/Size
4) Quote from NSDQ, Bid/Ask/BidSize/Asksize
5) Quote from PACF, Bid/Ask/Bidsize/Asksize
6) Trade from NSDQ, Price/Size
Plotting these out there will be 6 sequential entries (data points)
displayed on the chart (as each is represented by an individual data
point). As such, every quote and trade from every reporting exchange can be
seen in the charts and no data is lost due to time compression.
Unless otherwise specified (in the special condition quote/trade capture
parameter), ALL quotes and trades recorded by the Price Sequencer are
normal Condition 0 quotes and trades. Cancels, Out of Sequence, Inserts or
any other trade or quote not tagged as Condition 0 (normal) are
ignored.
The Quote Count/Time Line:
In viewing the charts, please note the time line at the bottom of each chart.
You will note each has a number and a time stamp:

In this example, there were 733 quotes or trades recorded at 10:49:15 (green arrow).
At 10:49:19 there had been a total of 2,932 quotes and/or trades recorded (red arrow).
At 10:50:17 there had been 7,330 quotes and/or trades recorded (blue arrow).
In another example we show 1 second of quote activity on a single chart and the
time line appears as:

As you can see, the actual time stamps are all the same (9:51:02) as all
of the quotes and/or trades were recorded in the same second of time. Only the
quote/trade counts vary, allowing you to determine how many quotes and/or
trades were made during the second. In this case sequentially from left to
right we see 712 quotes, 1423 quotes, 2134 quotes, 2845 quotes, 3556 quotes,
etc etc.
Because of the sequential plotting, time frames may appear to be non linear on
any given chart. That is to say each chart may not have the same time frame
in between each time stamp. For instance, suppose a stock has 1,000 quotes in a 1 second
period. After the first second the quote rate slows down and it takes another
10 seconds to accumulate 1,000 additional quotes. When viewing the full 2,000
quotes, the initial one second of 1,000 quotes will take 1/2 of the charting
space and the next 10 seconds of 1,000 quotes the remaining 1/2 of the chart.
A chart may also skip times if there is no quoting and or trading activity during that time. For
instance, if a stock has 100 quotes at 10:00:00, zero quotes at 10:00:01 and
another 100 quotes at 10:00:02, only 10:00:00 and 10:00:02 will be plotted and
shown on the chart, 10:00:01 will be absent as no quoting or trading occurred
during that time.
Time stamps are taken directly from the exchange time stamp sent for the
specific quote or trade.
Exchange Coloring:
We color bids prices and sizes using blue and green tones and ask prices and
sizes with red and yellow tones. Each exchange is colored with a different hue
so that differentiating between exchanges is purely a visual exercise. The
color legend for each exchange is shown in the upper left section of the
chart.
As an example lets look at a chart of AON on 7/29/2010, focusing on the ask
sizes (shown in the lower 1/2 of the chart):
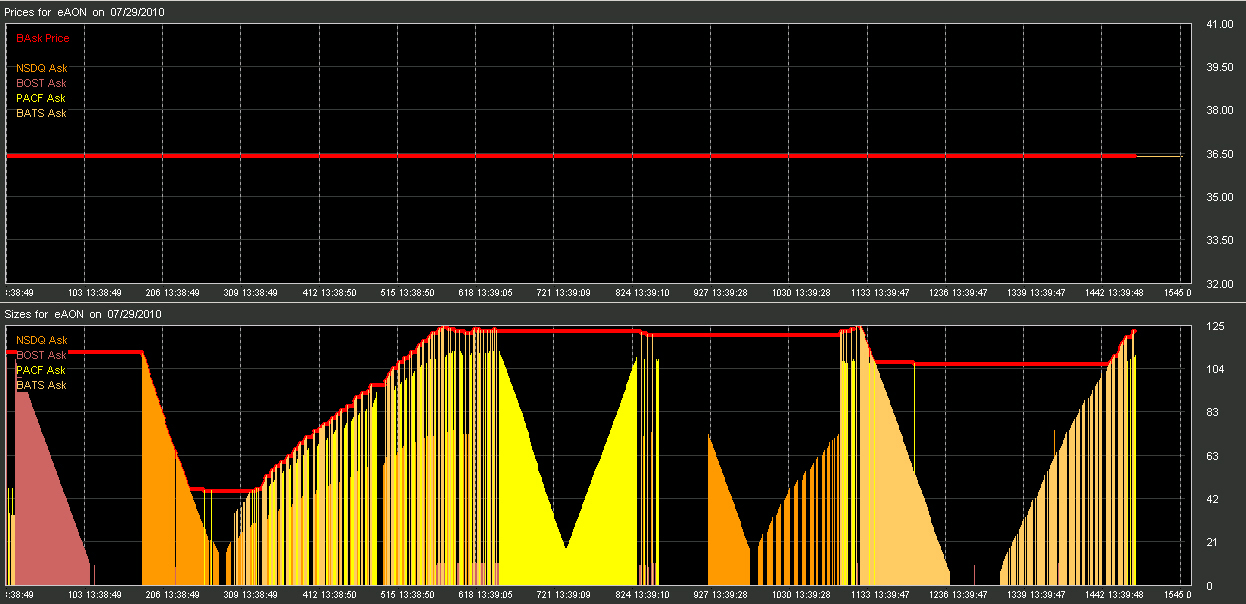
From the chart above you can see the ask sizes changing per quote from the
various exchanges. From the start of the chart (at 13:38:49) you can see
BOST first has a size repeater that quotes about 100 times, running the size
down sequentially as it quotes. Next you can see NASDAQ run a size repeater
(206 13:38:49) which also quotes about 100 times. From 13:38:49 through
13:39:05 we then see 3 exchanges quoting, NSDQ, BATS and PACF. Their quotes are
sequenced in the exact order received. Then at 13:39:05 we see only quotes from
PACF in yellow, running a size repeater down and then up again.
If the following chart we drill down on the above to see a more detailed slice
of a sequence:
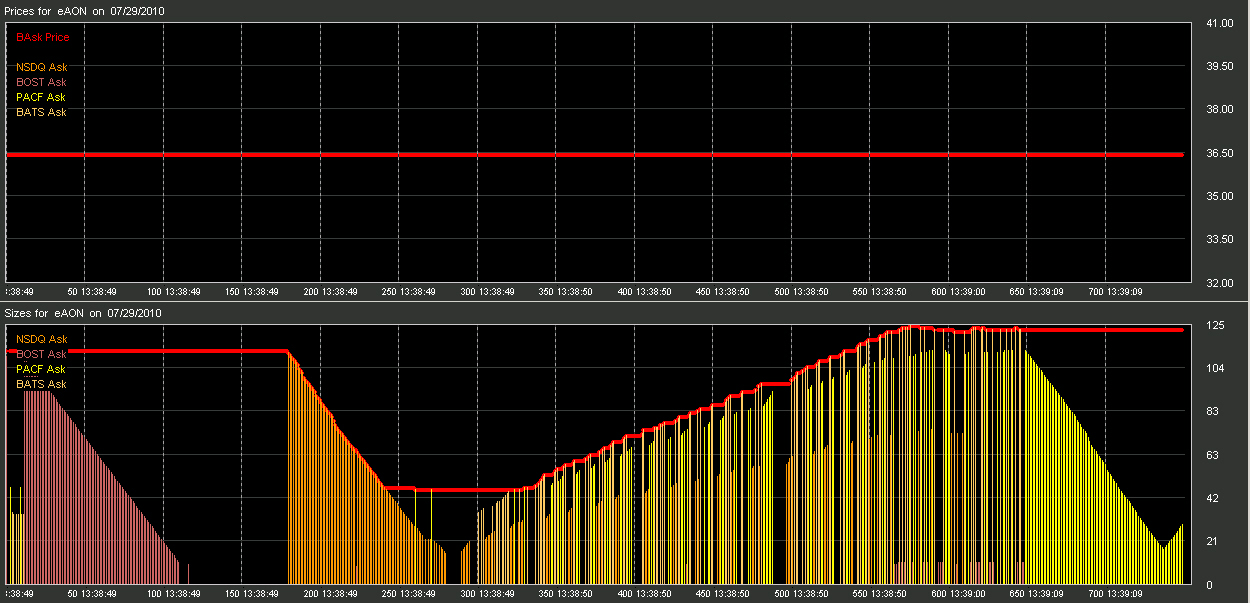
Examining the quotes at 13:38:50 you can see that every exchange quote is
recorded. If multiple exchanges are pinging off each other and/or quoting in
unison you will see this as every quote will be plotted as a separate data
point. In the 13:38:49 time frame, you can see that BOST and the NSDQ were the
only exchanges quoting.
Quotes which are the NBBO (Best bid and/or Best ask):
When a quoting exchange has captured the Best Bid or Best Ask, we will denote
this by either placing a red X or O at quote if the Best Ask has been captured,
or a green X or O at the quote if the Best Bid has been captured. In cases were
multiple exchanges are quoting we will color the X or O in the exchanges
designated color. In the following example, only one exchange is quoting
(NSDQ) and is capturing the Best Bid during this cycle:

|
Note in the above chart both bid and ask sizes are cycling, the ask price is
cycling and the bid price remains constant. When the Bid Size is cycled, the
quote becomes the Best Bid and a green "X" is placed on the quote to
denote this quote is the current Best. When the bid size drops the quote looses
the BBO and does not appear with the green "X". This cycle continues
through the entire sequence. When plotting the entire sequence of 3,000 quotes
the result appears as:

Charting this many quotes compresses the chart into nearly flat bars. However
it is clear to see the quotes capturing the Best Bid (thus generating a
larger quote packet) throughout the sequence.
Determining Quoting Exchanges:
The majority of charts we display in the Crop Circle of the Day page are burst
of quotes sequentially from one exchange with no other exchange quoting.
Because the Price Sequencer captures every quote from every exchange and charts
everything, making this determination is easy.
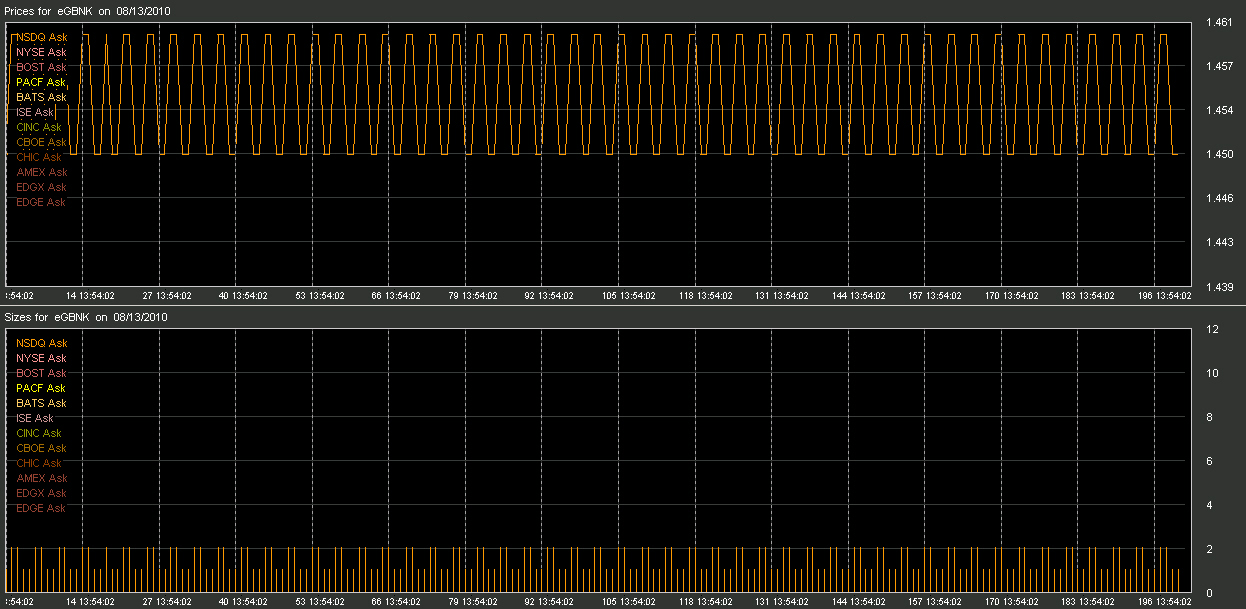
In the following chart, we plotted only the ask prices. We are tracking all
exchanges and plotting all results. The legend in the left indicates all the
reporting exchanges we are plotting. However, it appears that only NSDQ is
quoting:
To verify this, we turn NSDQ off in the plot:
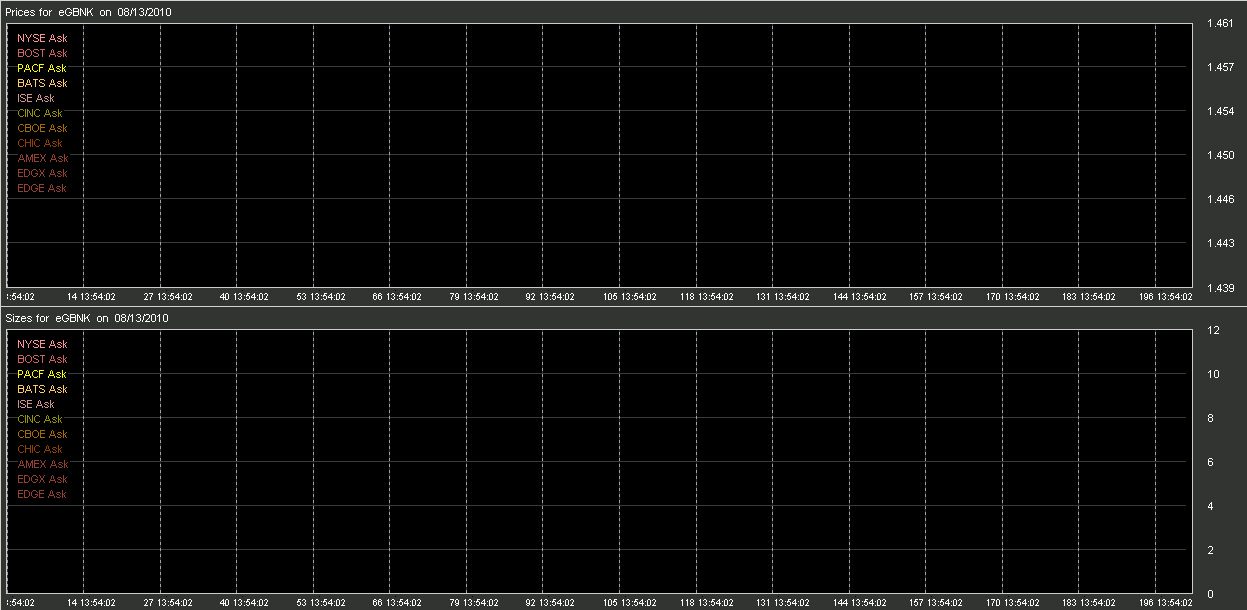
As you can see, no other exchange was quoting at this time. We now turn only
NSDQ on for plotting:

And we see the same chart again. What this means is that during the recorded
time-frame only the NSDQ exchange was quoting on this issue.
| |
Inquiries: pr@nanex.net
Publication Date: August 23, 2010
http://www.nanex.net
| This report and all material shown on this
website is published by Nanex, LLC and may not be reproduced, disseminated, or
distributed, in part or in whole, by any means, outside of the recipient's
organization without express written authorization from Nanex. It is a
violation of federal copyright law to reproduce all or part of this publication
or its contents by any means. This material does not constitute a solicitation
for the purchase or sale of any securities or investments. The opinions
expressed herein are based on publicly available information and are considered
reliable. However, Nanex makes NO WARRANTIES OR REPRESENTATIONS OF ANY SORT
with respect to this report. Any person using this material does so solely at
their own risk and Nanex and/or its employees shall be under no liability
whatsoever in any respect thereof. |
|
|
|

