May 6'th 2010 Flash Crash Analysis
Continuing Developments - Recovery of the Flash Crash - Supply and
Demand
Publication Date: 09-15-2010
Back to Table Of Contents
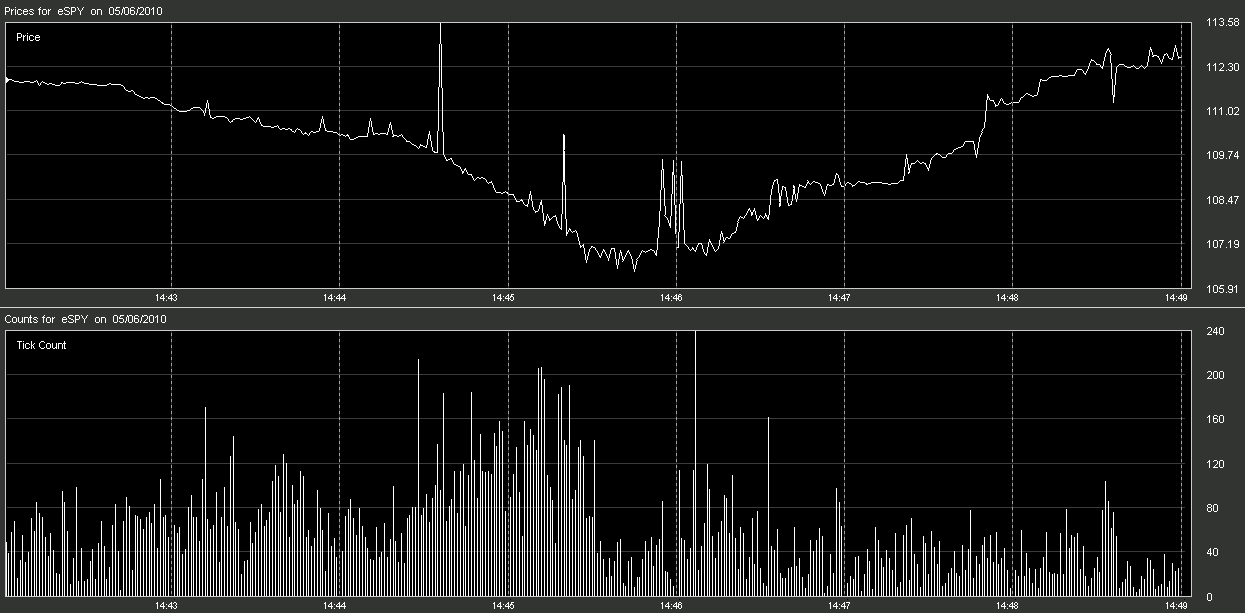
This is a 1-second chart of the Spyder ETF (symbol SPY) showing the
sell-off and recovery on May 6, 2010. We included the tick volume (the count
of the number of trades for each second) plotted at the bottom. What this
chart shows is that the recovery occurred not due to strong demand, but rather
because there were few sellers left. If it were due to strong demand, the
volume would have been much much higher. This is a simple matter of supply and
demand.
Basically, when the shelling stopped, there was no one left standing with good
pricing information -- and when the shorts went to cover and buy back stock
they found prices rocketing skyward with almost no effort. |
| |
Inquiries: pr@nanex.net
Publication Date: 09-15-2010
http://www.nanex.net
| This report and all material shown on this
website is published by Nanex, LLC and may not be reproduced, disseminated, or
distributed, in part or in whole, by any means, outside of the recipient's
organization without express written authorization from Nanex. It is a
violation of federal copyright law to reproduce all or part of this publication
or its contents by any means. This material does not constitute a solicitation
for the purchase or sale of any securities or investments. The opinions
expressed herein are based on publicly available information and are considered
reliable. However, Nanex makes NO WARRANTIES OR REPRESENTATIONS OF ANY SORT
with respect to this report. Any person using this material does so solely at
their own risk and Nanex and/or its employees shall be under no liability
whatsoever in any respect thereof. |
|
|
|

