The eMini July 5th/6th Liqudity Dryup
|
Back to
Table Of Contents
On March 8 2012 we referenced data showing liquidity drying up a minute before the
MBA Purchase Applications
number.
Since then, we have been tracking patterns in liqudity drying up in the eMini:
Today we present more evidence showing the same behavior based on the major announcements on Thursday July 5th and Friday July 6th of 2012.
|
The following images show CME's eMini future (S&P 500) depth of book
and trades paired with one second bar charts showing price movements over roughly the same time period.
The DepthMap images are rainbow (ROYGBIV) color-coded by the relative size
at each depth level. Red indicates a lot of size, violet indicates size
approaching 0. Note that a full minute before each event, the depth starts
cooling rapidly. The volume of contracts traded is represented at the bottom of
the chart.
If you are interested in the best examples of these phenomena feel free to skip ahead to the following:
Otherwise just continue down the page. All occurrences are in chronological order.
*Updated*
Later on in the summer, we noticed a much different looking pattern.
We attributed it to tightend security for news releases as covered by the NY Times: U.S. Tightens Security for Economic Data
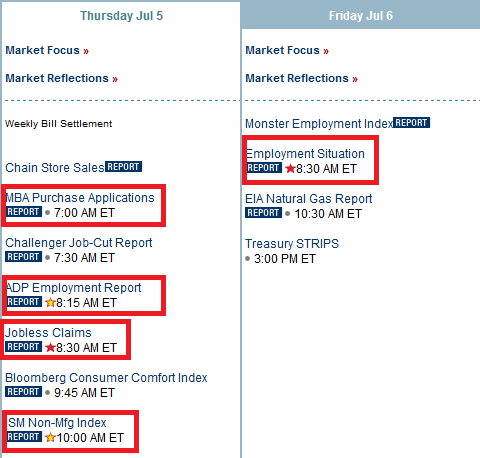
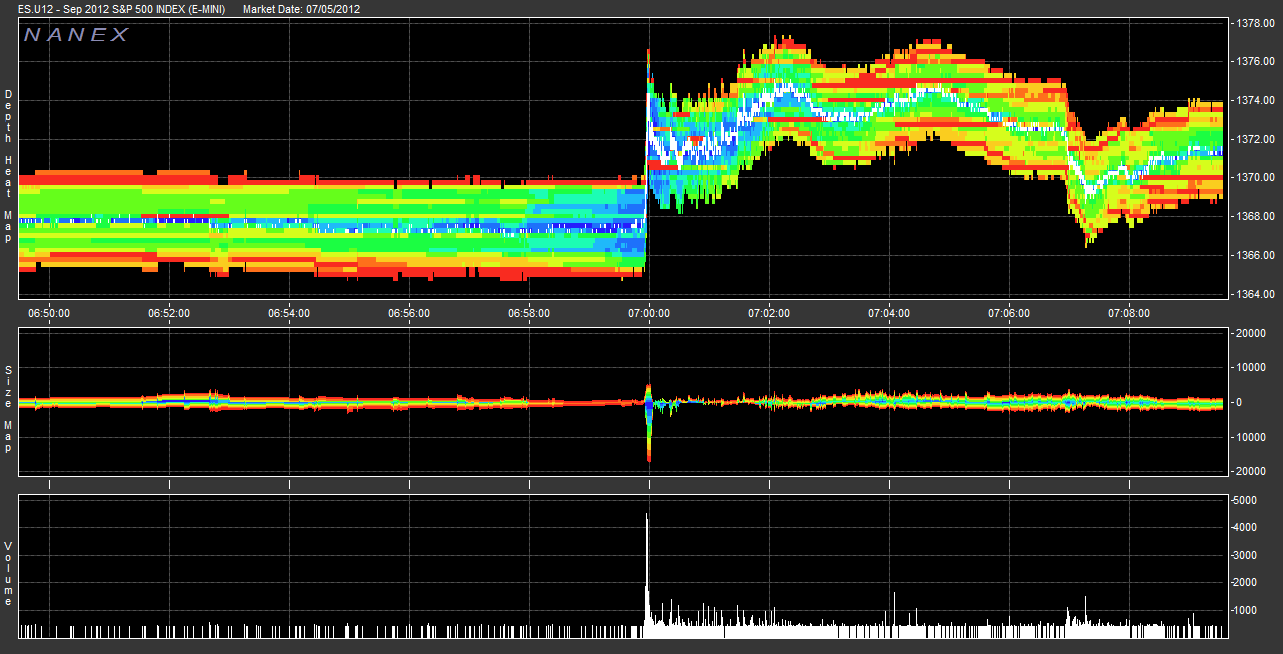
July 5, 2012:
7:00am

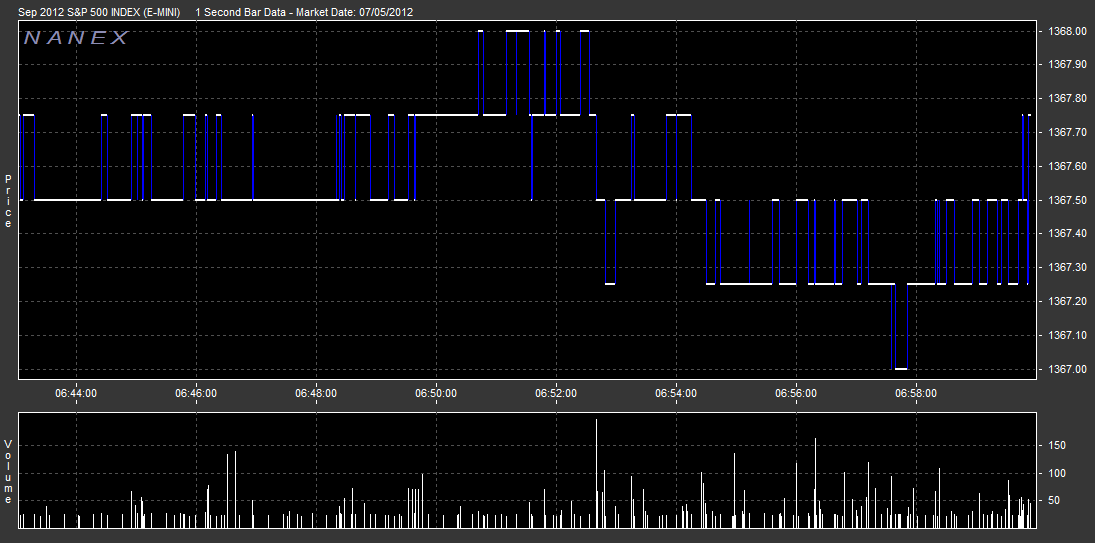
This event is caused by the release of the MBA Purchase Applications
number at 7:00am. Notice the spike in volume and depth at 6:59:58. While the few minutes leading up to 7 the volume starts to dry up (blue).
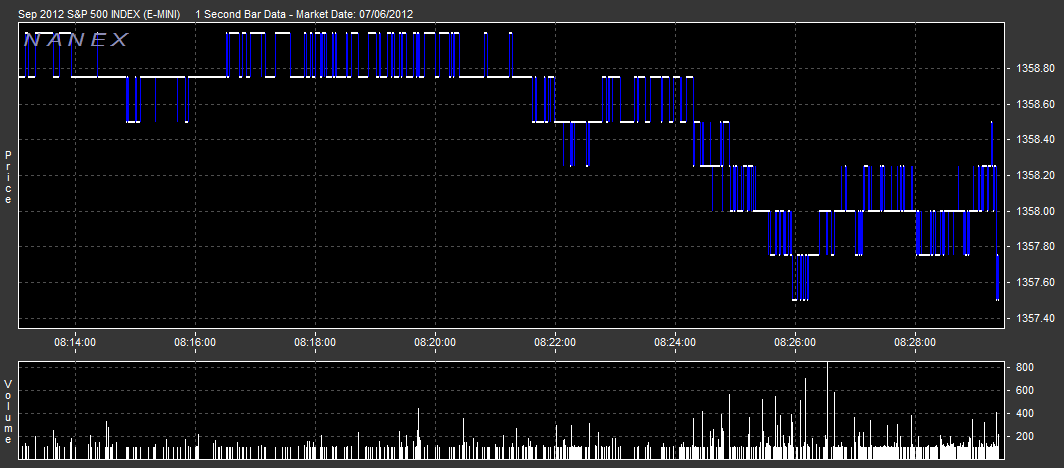
Here is a one second bar chart over roughly the same time period (both charts have auto-sizing so they are slightly out of alignment).
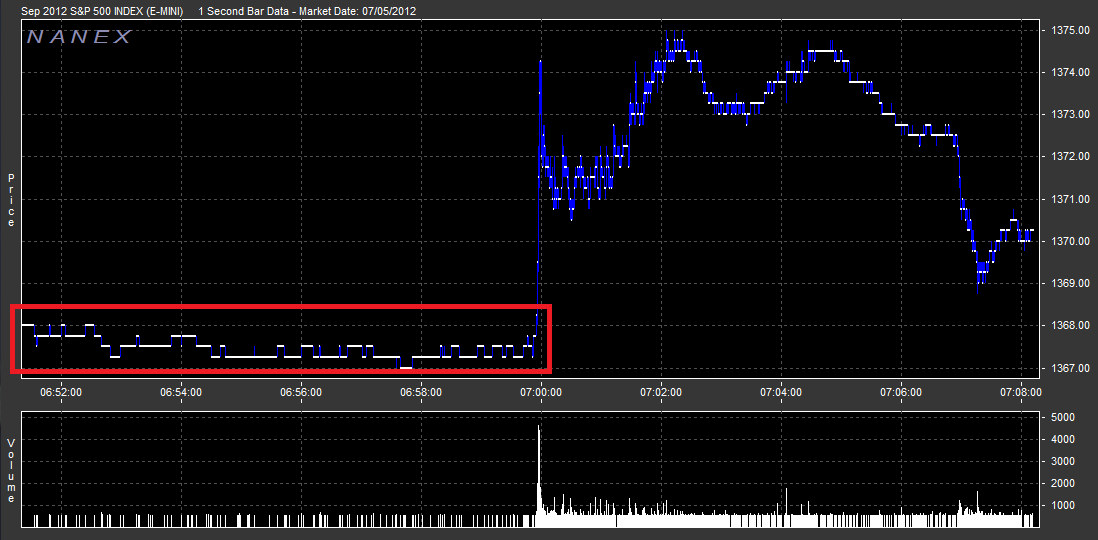
Lastly, if you check out the highlighted section above. You will notice a distinct "square wave" pattern. Indicative of algo based trading.
The two minutes prior to the announcement is "business as usual" for the algos.
Surprise! Organic Liquidity Dryup. If you check official announcement list, the next official announcement was at 7:30am.
This news passed without fanfare, but something else interesting happened on the way to 8:15...
Edit: Some further research indicates that it might have been caused by this announcement:
President Mario Draghi discussed the ongoing threats to the Eurozone economy
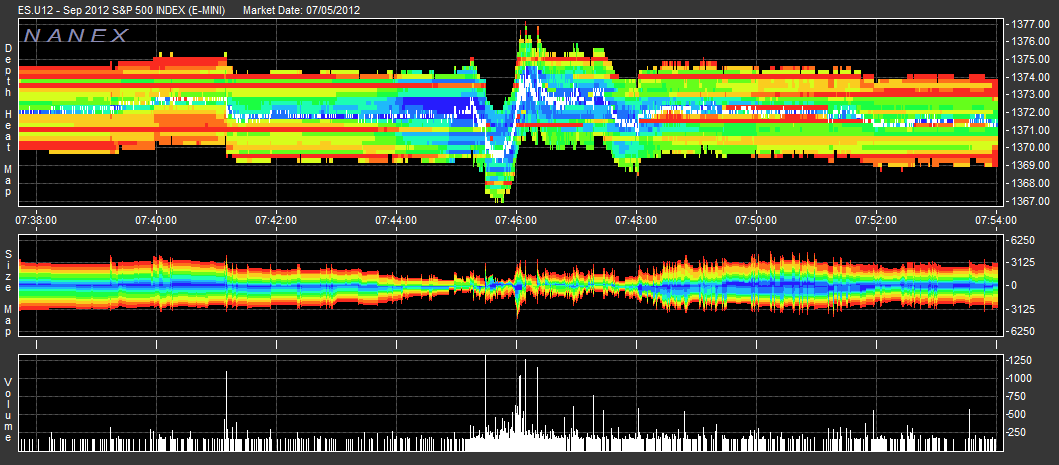
This liquidity dryup wasn't "planned" but you can see a similar pattern emerge... organically. HFT and Machine Learning algos like predictable patterns.
They would rather make pennies (or fractions of a penny) in a sure bet, than deal with trying to predict and be on the right side of a
large price swing. This image shows this type of behavior outside of a major announcement. You can see at about 7:45 "something" in the market
starts exiting as the DepthMap starts to cool down. Then sure enough, a little before 7:46 there is sharp drop and then rise in price. The smart
algos detected higher volatility and sat on the sidelines until things cooled down a bit until they could get back in on the "sure bet".
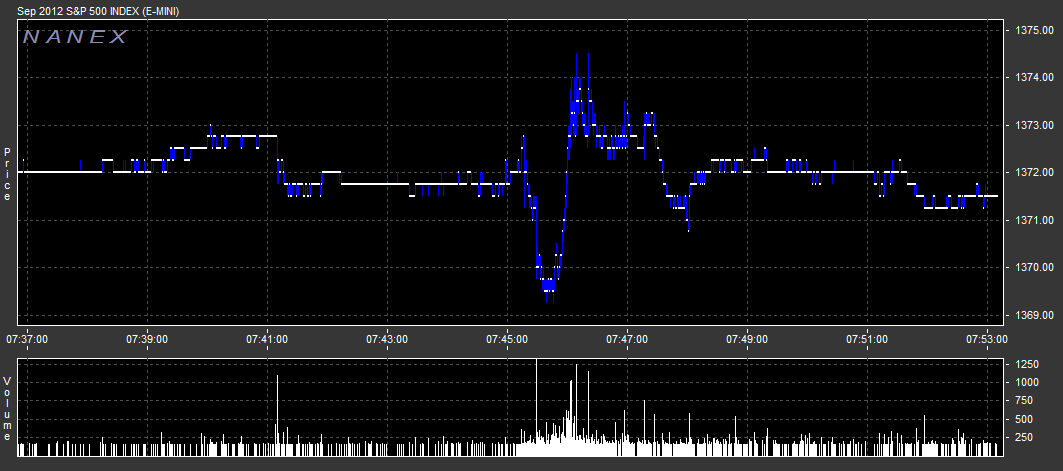
Here is a one second bar chart over roughly the same time period (both charts have auto-sizing so they are slightly out of alignment).

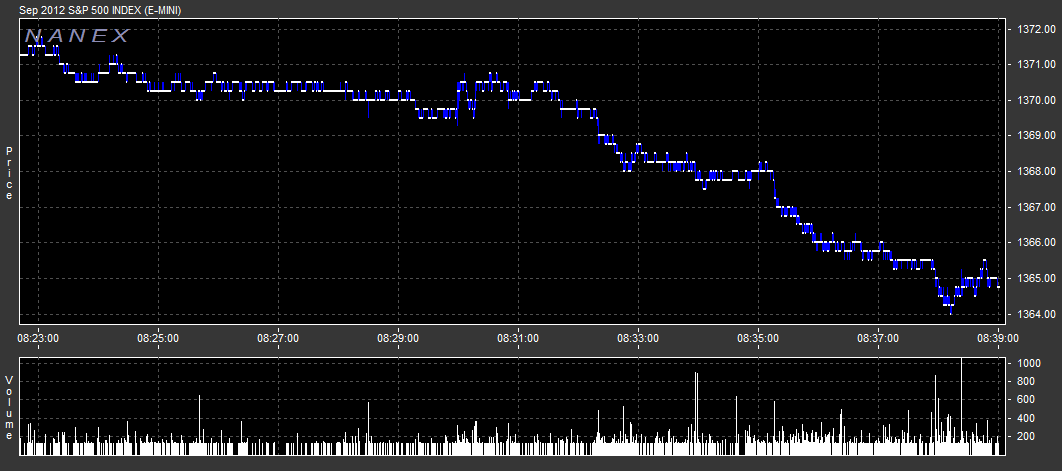
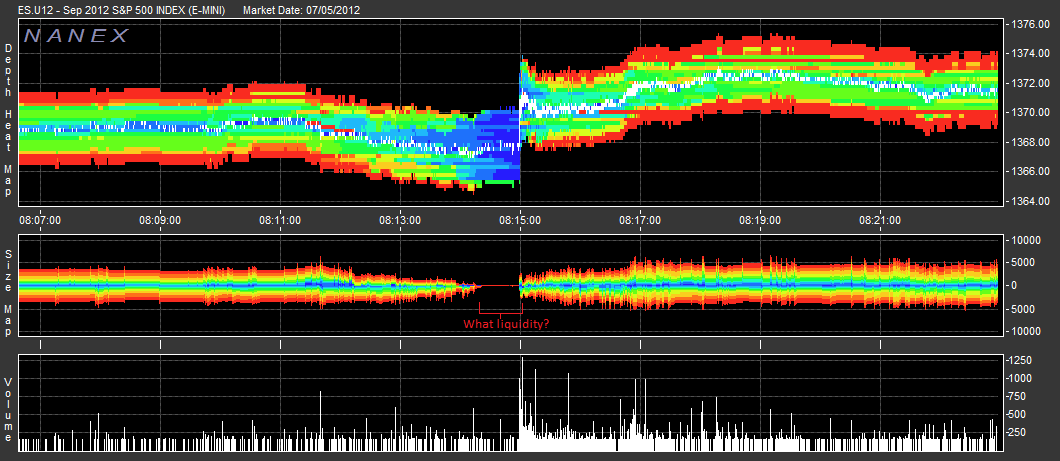
This event is caused by the release of the ADP Employment Report
number at 8:15am. The section to pay attention to in this image is the Size Map. The depth of book drops to basically ZERO in the minute leading up to the reports.
And then at 8:15am the price shoots way up on high volume when the bots, after having officially read the news coming across the wire get back in full tilt.
Here a one second bar chart over roughly the same time period (both charts have auto-sizing so they are slightly out of alignment).
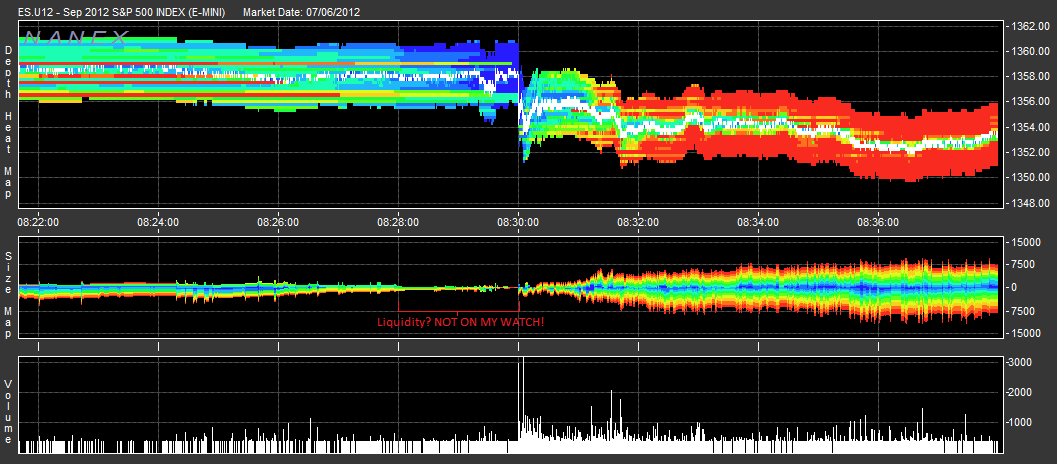
8:30am
This event is caused by the release of the Jobless Claims
number at 8:30am. Notice that the algos dried up (as expected) pre-8:30, then when there wasn't any earth shaking news, both the price and volume stayed relatively flat.
At this point, the day's news had already been "priced in" but the algos still pulled out in the crucial minute before the announcement "just in case".
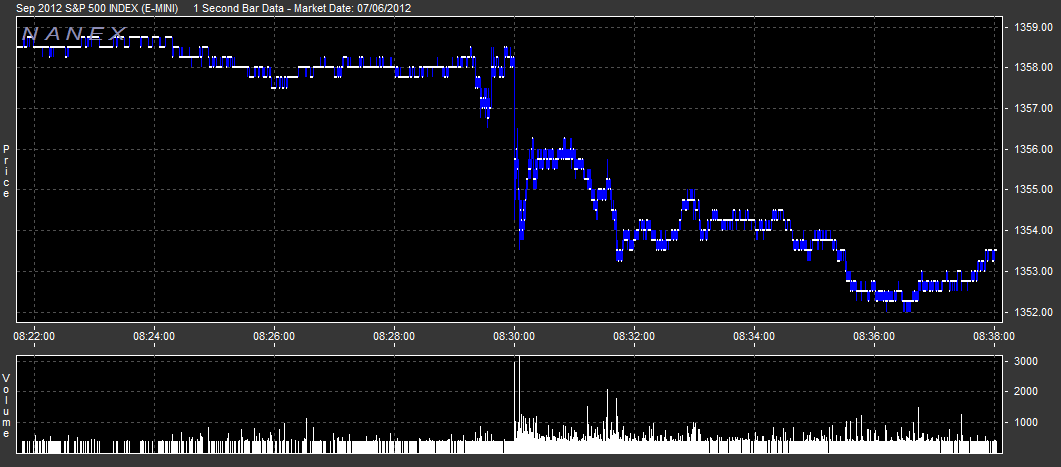
Here a one second bar chart over roughly the same time period (both charts have auto-sizing so they are slightly out of alignment). Note the price stays relatively flat.
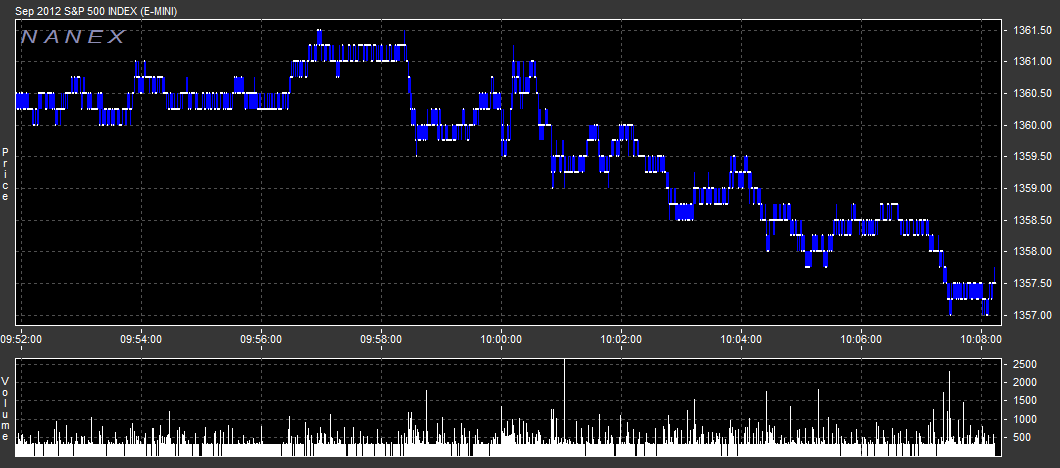
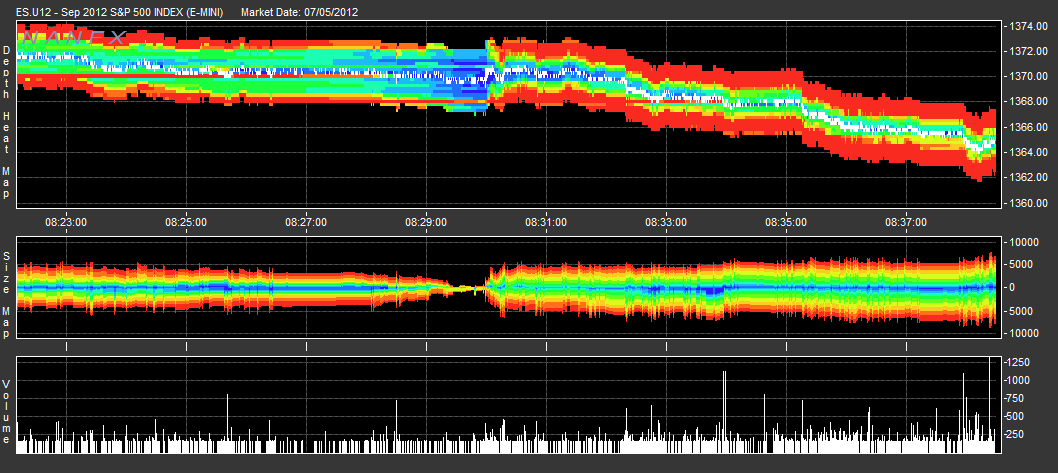
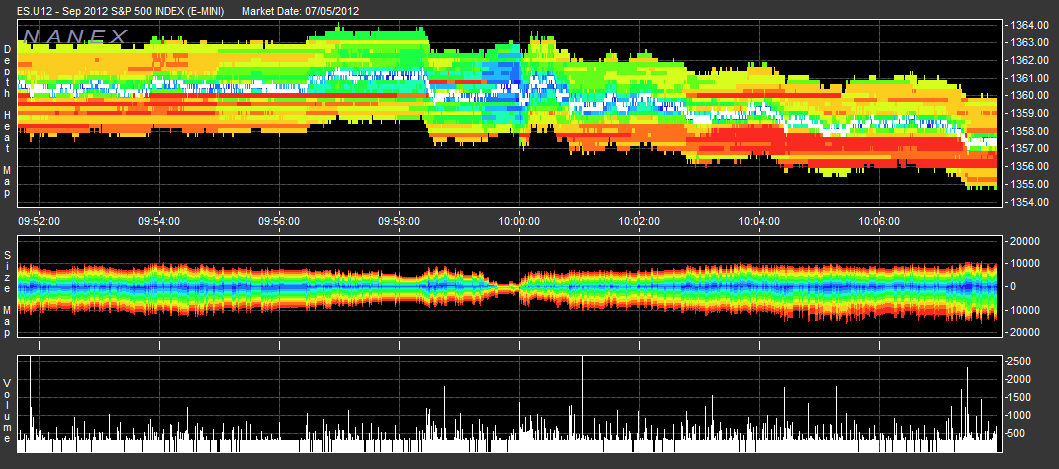
10:00am

This event is caused by the release of the ISM Non-Mfg Index
number at 10:00am. Notice that the algos dried up (as expected) pre 8:30, then when there wasn't any earth shaking news, both the price and volume stayed relatively flat.
At this point, the day's news had already been "priced in" but the algos still pulled out (although less than the crucial minute before the announcement "just in case".
Here is a one second bar chart over roughly the same time period (both charts have auto-sizing so they are slightly out of alignment). Note the price stays relatively flat through the 10:00am time period.
July 6, 2012:

This event is caused by the release of the Employment Situation
number at 8:30am. Notice that the high end bots start getting out en-mass long before the official announcement.
A full two minutes before the announcement algos are running for the sidelines as fast as their little AI brains can take them. By the time 8:30ET rolls around,
anyone still in the eMini is going to get slaughtered by the volume in the first few seconds after the announcement. After about two minutes at 8:32ET, it's business as usual
and the eMini goes into it's "fire-hose mode" of huge depth on both sides of the book (solid red with a big fat Size Map).
Here is a one second bar chart over roughly the same time period (both charts have auto-sizing so they are slightly out of alignment).
Lastly, if you check out the highlighted section above. You will notice a distict "square wave" pattern. Indicative of algo based trading.
Humans beware! The two minutes prior to the announcement is "business as usual" for the algos.
Conclusion: HFT traders and AI bots/algos DO in fact provide liquidity... but only when it's to their advantage.
The AI algorithms thrive on speed and like the Christmas Tree Worm that fans its tenticles and sucks nutrients
out of passing microscopic sea life, they are quick to retract from the market if any whiff of danger (losing money) is detected.
|
| |
Inquiries: pr@nanex.net
Publication Date: 06/16/2011
http://www.nanex.net
| This report and all material shown on this
website is published by Nanex, LLC and may not be reproduced, disseminated, or
distributed, in part or in whole, by any means, outside of the recipient's
organization without express written authorization from Nanex. It is a
violation of federal copyright law to reproduce all or part of this publication
or its contents by any means. This material does not constitute a solicitation
for the purchase or sale of any securities or investments. The opinions
expressed herein are based on publicly available information and are considered
reliable. However, Nanex makes NO WARRANTIES OR REPRESENTATIONS OF ANY SORT
with respect to this report. Any person using this material does so solely at
their own risk and Nanex and/or its employees shall be under no liability
whatsoever in any respect thereof. |
|
|
|