|
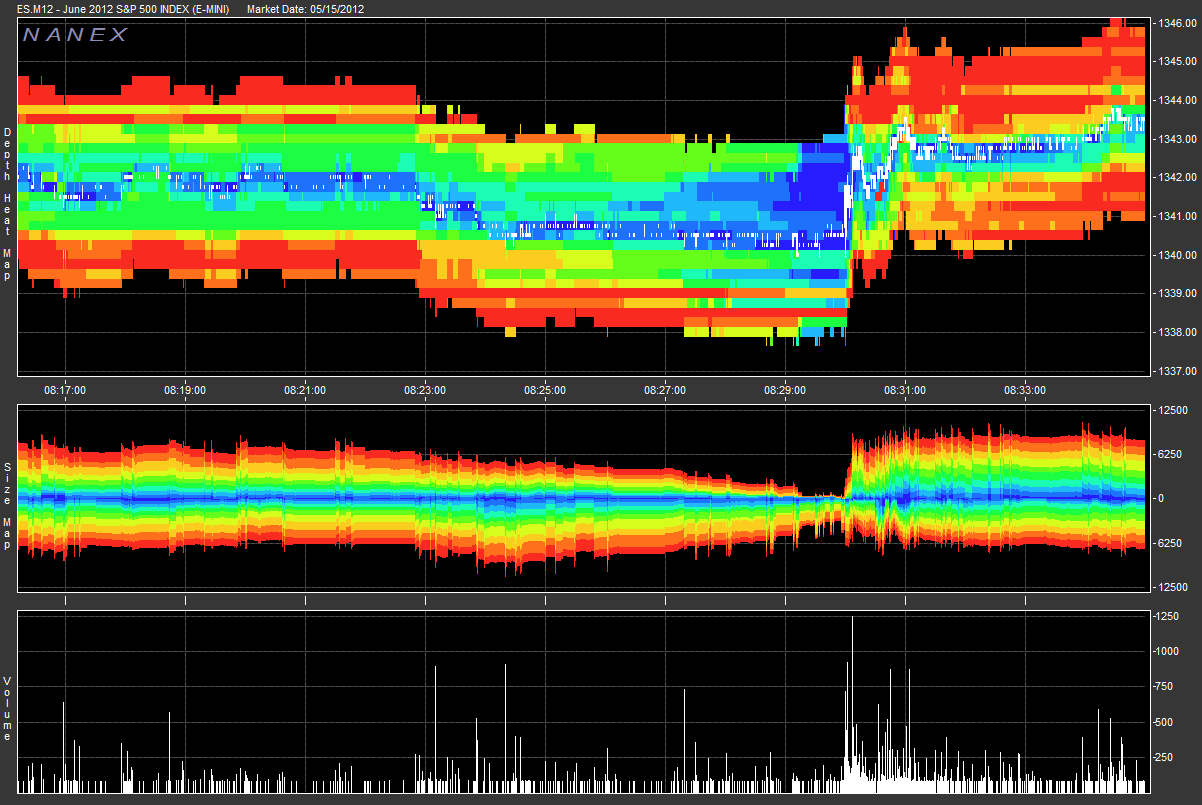
The following images show CME's eMini future (S&P 500) depth of book and trades.
The images are rainbow (ROYGBIV) color coded by the relative size at each depth level.
Red indicates a lot of size, violet indicates size approaching 0. Note that a full minute
before each event, the depth starts cooling rapidly. The volume of contracts traded is
represented at the bottom of the chart.
The data shown was taking during the CPI announcments on 05/15/2012, 06/14/2012, and 07/17/2012.
Note the spike in volume starting a little before 8:30:00 AM and directly after it.
This happens on both 05/15/2012 and 06/14/2012. But on 07/17/2012, this "spike" right at the announcement time didn't happen.
One possible explanation of this is the tightening of security on economic data as published by the NY Times:
U.S. Tightens Security for Economic Data
Also pay attention to the total volume as of 8:31 AM on each occasion. The total volume leading up to the announcement on 07/17/2012 was a little bit less than half of the volume on 06/14/2012.
|