Nanex Research

Nanex ~ 26-Dec-2012 ~ Orchestrating Chaos
On December 26, 2012 at 11:02:59, the market suddenly exploded with activity (SPY dropped
below 141.88 - a low set 12 days earlier on December 14). Approximately 3,800 March
2013 eMiini futures contracts (S$P 500) were sold during that second. We
thought the sudden explosion in activity warranted a closer look.
What we found was fascinating. It appears the entire market-wide move may have been
carefully orchestrated. One thing for certain is that our regulators will never be able
to see the big picture if their analysis tools (MIDAS) only looks at equity data. Analyzing
price moves in futures and options is crucial to understanding market-wide moves in
equities, and visa versa.
We'll start by comparing 4 charts: SPY, ES.M13, all NMS Equity Trades and all Option
Trades,
for one second of time beginning at 11:02:58.600.
From the charts above, it is not clear whether the activity started with ES.H13, so
we'll zoom in on 135 milliseconds of time, starting at 11:02:59.360
From the charts above, it looks like activity started in ES.H13 at 11:02:59.420, and
in SPY about 4 milliseconds later. But chart 3 shows activity in some NMS stocks also
at 11:02:59.420. It takes about 6 milliseconds for information to travel between NY
(where stock and options trade) and Chicago (where the emini futures trades). The timestamps
are from the exchanges, so it's possible they might not be perfectly synchronized, though
there's no excuse for that in today's high frequency trading world.
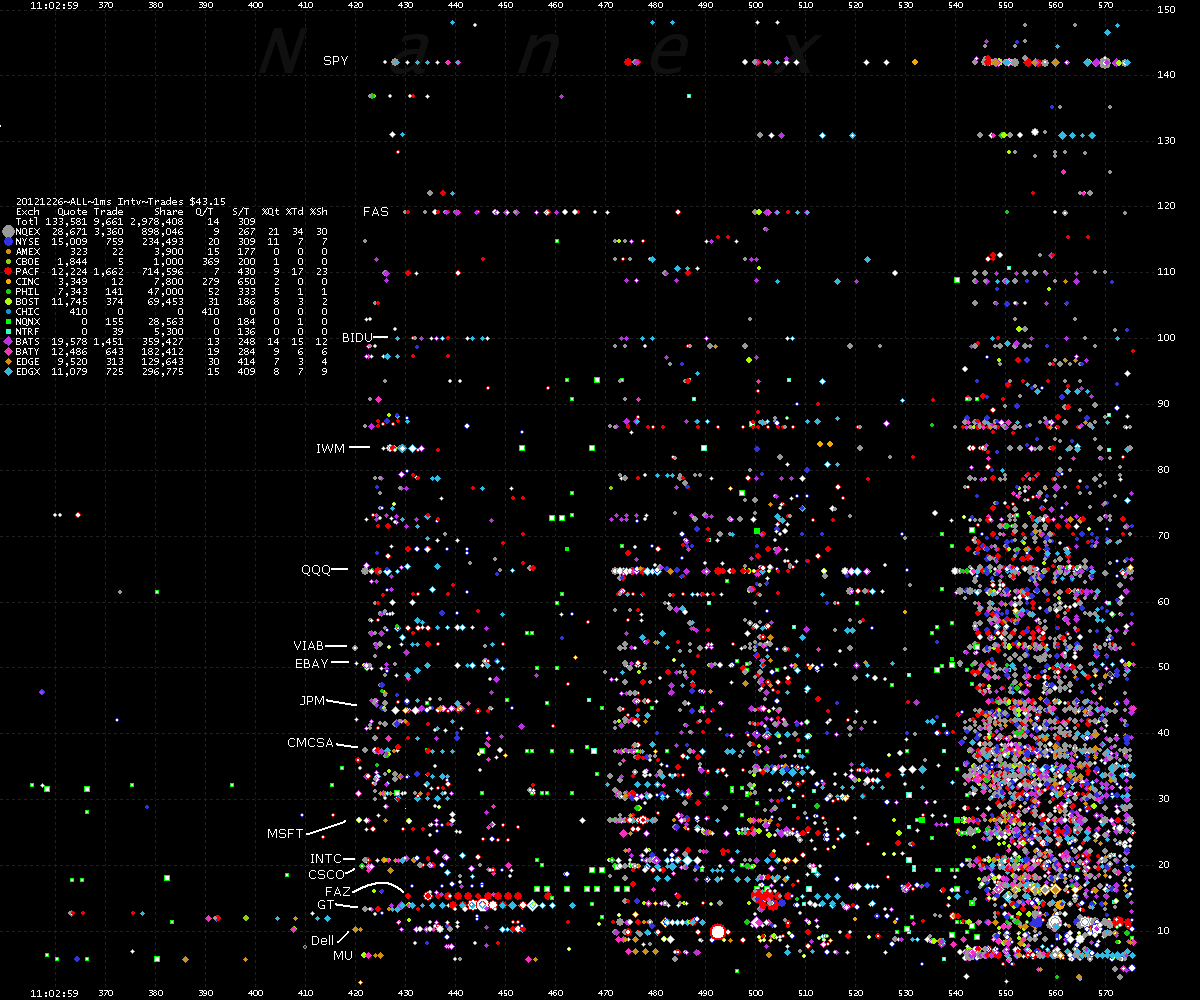
Let's look closer at the chart of all NMS Stock Trades.
All NMS Stock Trades - 1 millisecond interval chart showing trades color coded by exchange.
Some of the active, known symbols have been labelled. Note many large cap stocks show
activity starting the same time as the eMini.

Now let's look closer at the final drop, by zooming in on 135 milliseconds of time,
starting at 11:02:59.450
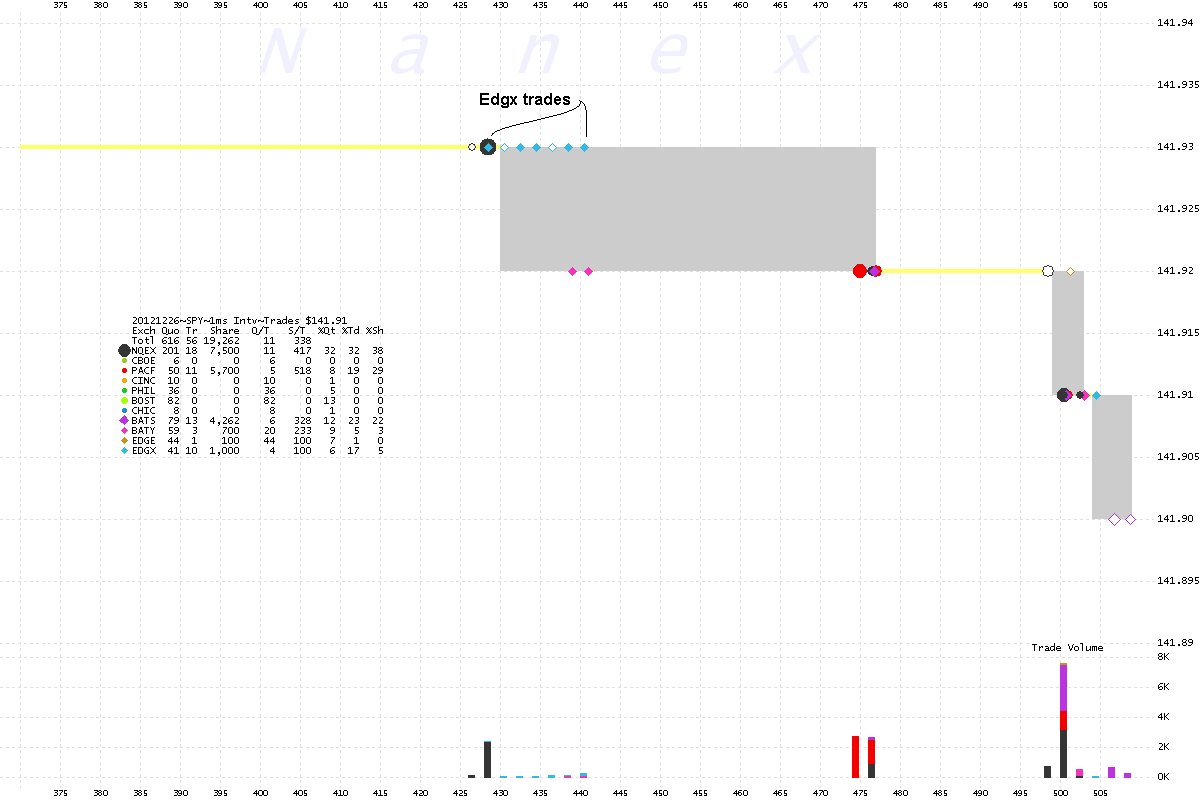
Circling back to the first chart, when we looked closer at SPY for a 25 millisecond
period of time beginning at 11:02:59.424, we noticed something interesting. Note the
trades from EDGX (blue diamonds). Now let's take a closer look in the chart below.

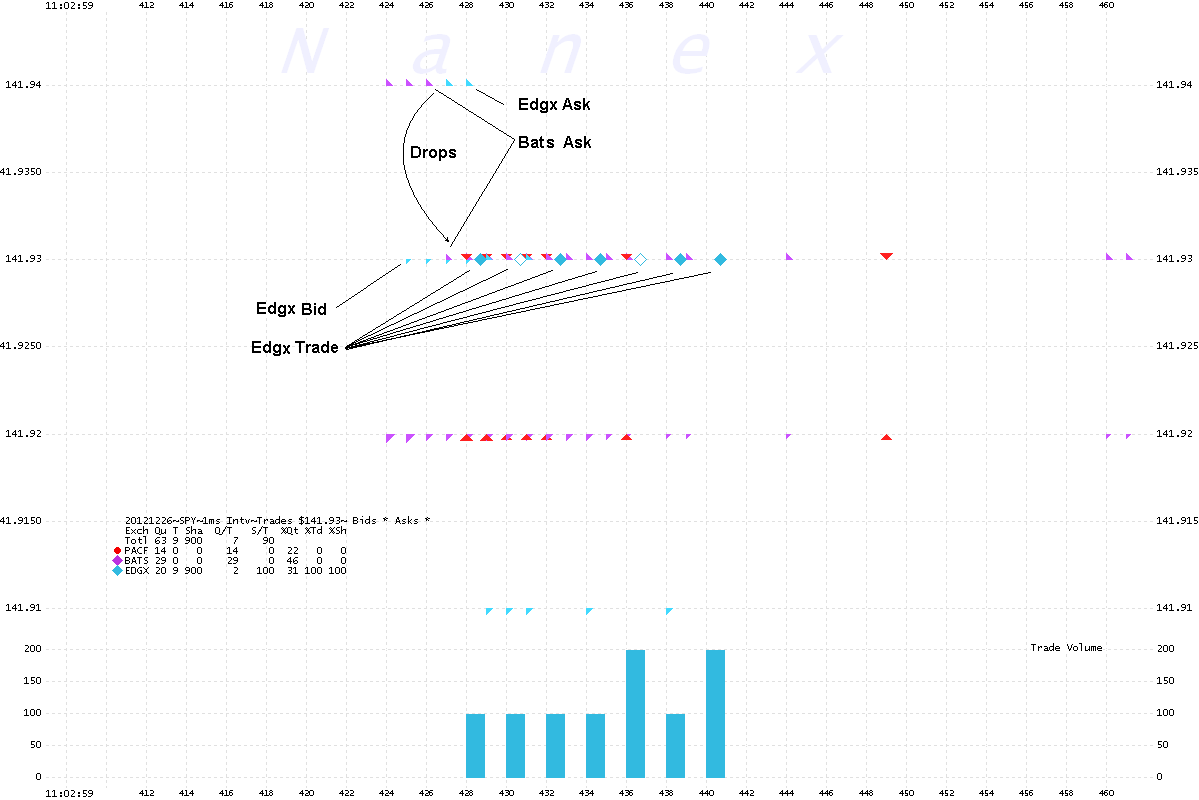
In the chart below, we show bids and asks from a few exchanges to remove clutter. Here,
we show just EDGX (blue), BATS (pink) and ARCA (red).
Here is a
link to Excel Spreadsheet of all SPY trades and quotes between
11:02:59.424 to 11:02:59.450
This spreadsheet shows just updates to EDGX trades and quotes
and is sequenced in the order they likely occurred.
From the spreadsheet and/or the chart below: the bid from EDGE remains at 141.93 and we see several quote updates from
EDGX that don't change the bid or ask price or size. These appear to be generated after
a trade executes at EDGX at 141.93 (but the trades get reported late, so they aren't
in sequence with these EDGE quote updates). It's almost
as if someone wanted to keep the quote locked and price high as long as possible before
allowing the price to ratcheted down.

Nanex Research
Inquiries: pr@nanex.net


