Nanex Research

Nanex ~ 30-Apr-2013 ~ Persons with Interest
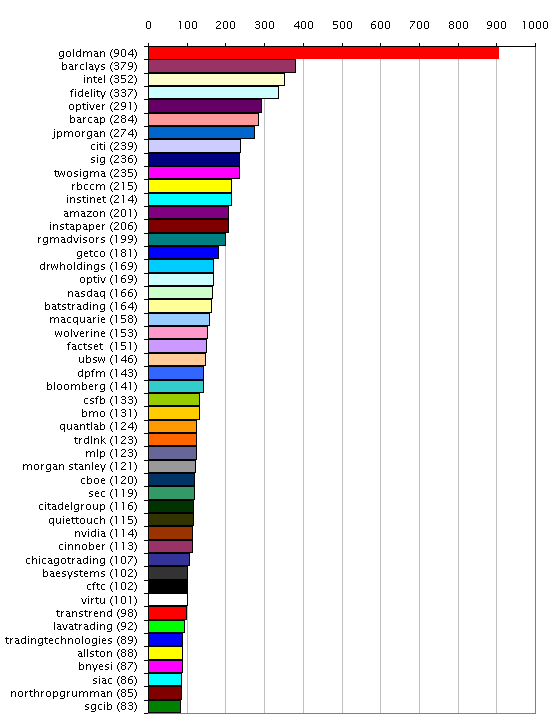
The pie chart below shows the count of hits (visits) from the top 50 visitors to our
original flash crash report, between June 18, 2010 (when it was published),
and July 6, 2010.
Note, if we include hits from our machines used to publish and check the pages on our
site, we would come in behind the top visitor. That's right, the top visitor visited
more than we did.
1. Count of Visits by Reverse-IP Between June 18 to July 6, 2010.
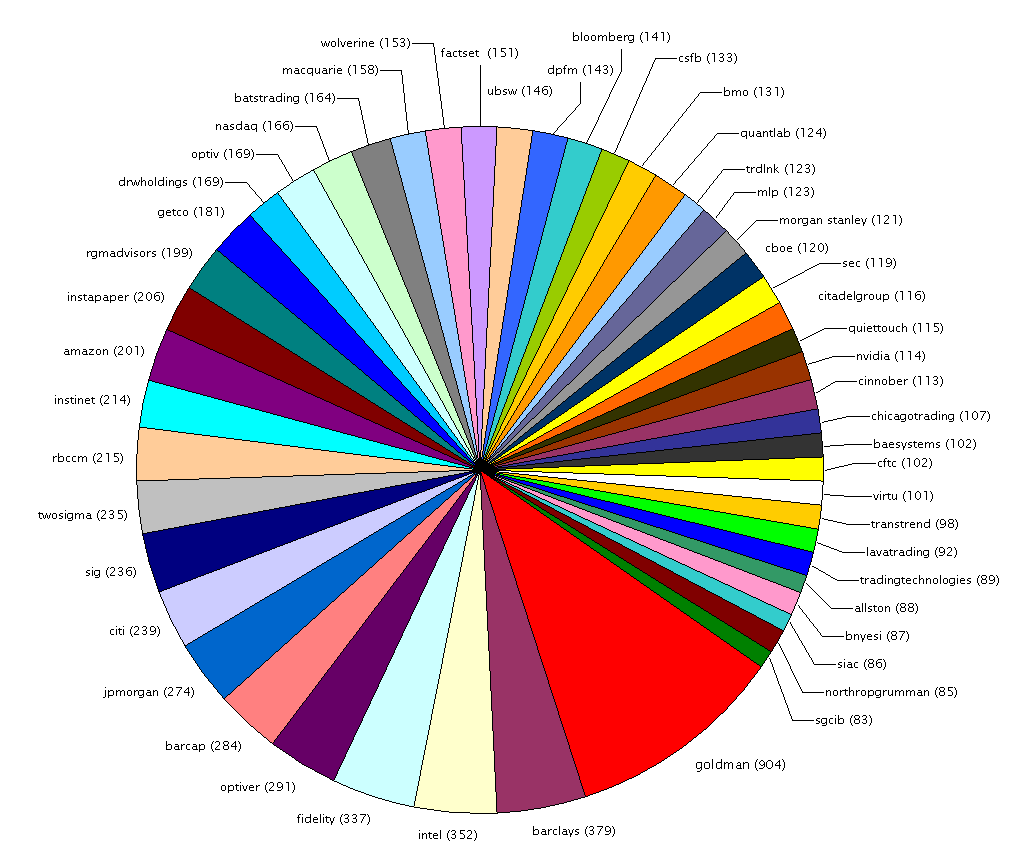
2. Same data as above, but as a pie chart.
Nanex Research
Inquiries: pr@nanex.net