Nanex Research

Nanex ~ Not Published ~ eMini High Activity Events
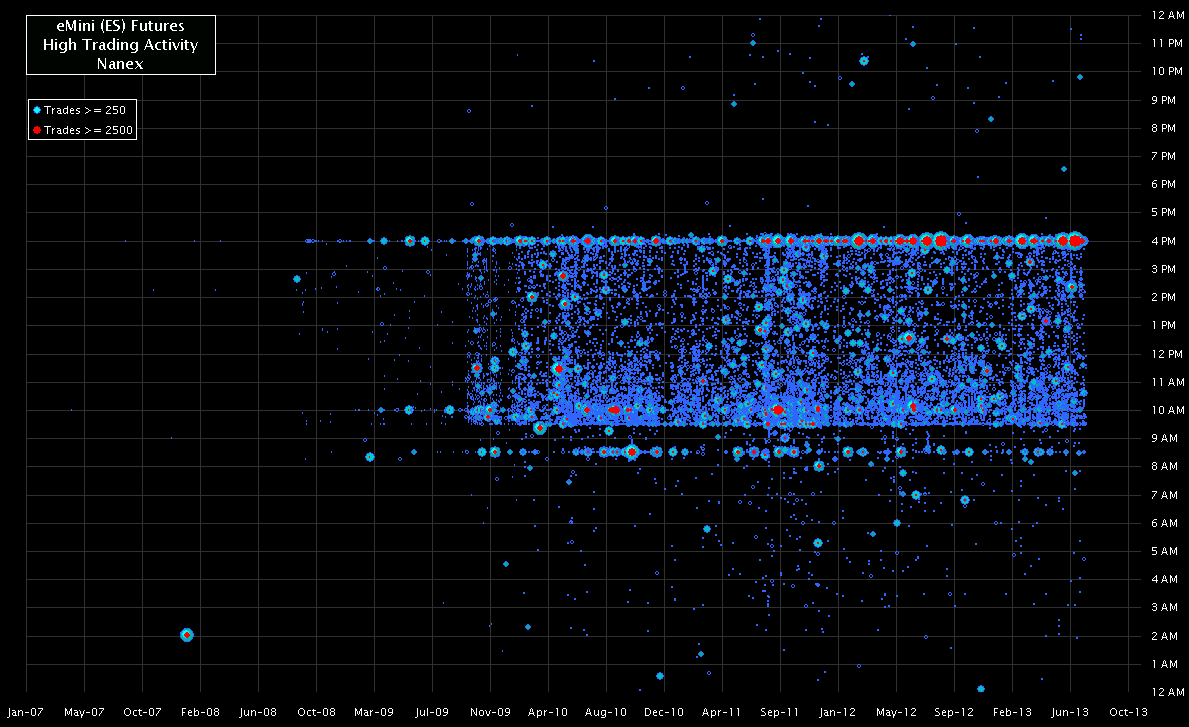
The charts below plot the date, time and relative number of trades of every short-term explosion in trading activity in the eMini Futures contract (ES) since 2003. Note that these charts only plot from January 2007: that is because before then (at least back to 2003), there were zero instances that qualified to make this list. In other words, these trading frenzies are caused by high frequency trading - which didn't reach speeds capable of causing suitably excessive mayhem until late 2007.
1. Showing all events over a 24 hour period from 2007 through July 23, 2013.
Note, there is no activity between 2003 and 2007, so we didn't include that period in
the plots below - there's nothing to draw.
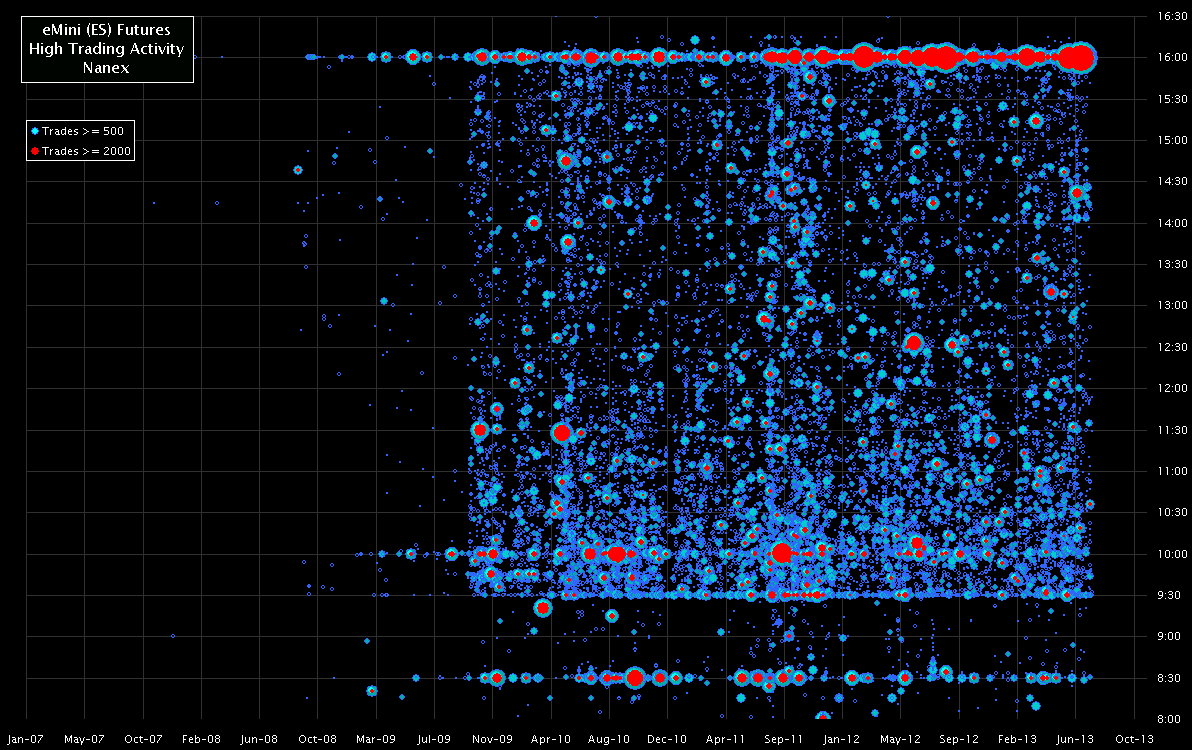
2. Showing events between 8:00 and 16:00 Eastern Time from 2007 through July 23,
2013.
At this scale, you can make out several horizontal bands cause by events that occur
at the same time of day.
- 8:30 - is market reaction to (mostly) government released economic news.
- 9:30 - Regular trading session opens for U.S. Stocks.
- 10:00 - scheduled economic news.
- 14:00-14:30 - from Federal Reserve announcements on interest rate policy.
- 16:00 Regular trading session closes for U.S. Stocks. Note the significant growth
in magnitude of activity events at the close. This is from HFT gaming the last millisecond
of the day.
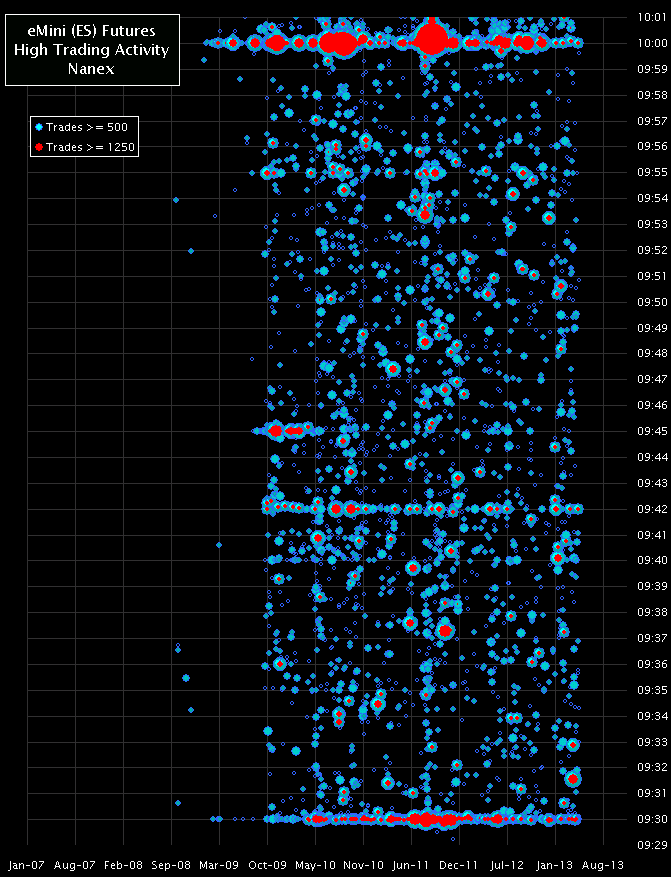
3. Showing events between 9:29 and 10:01 Eastern Time from 2007 through July 23,
2013.
We compressed the width of the chart to make it easier to see several horizontal bands
from events that occur
at the same time of day.
- 9:55 is from the release of the Michigan Consumer Confidence number which used to
be released 2 seconds early at 9:54:58 to elite HFT.
- 9:42 is from the early release of Chicago PMI to elite HFT.
- 9:45 - this is a partial band that started strong, then withered and stopped. It
was caused by the release of the Chicago PMI. Those getting the information at 9:45
very likely did not know that some people were paying to get it 3 minutes earlier
at 9:42. When they found out, the market stopped suddenly stopped reacting to the
9:45 release.
Nanex Research
Inquiries: pr@nanex.net