Nanex Research

Nanex ~ 25-Oct-2013 ~ 600,000 Google Option Quotes in
1 Second
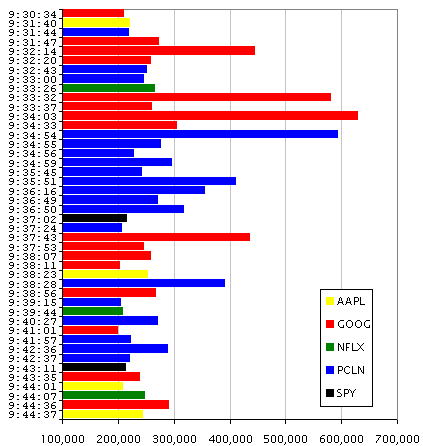
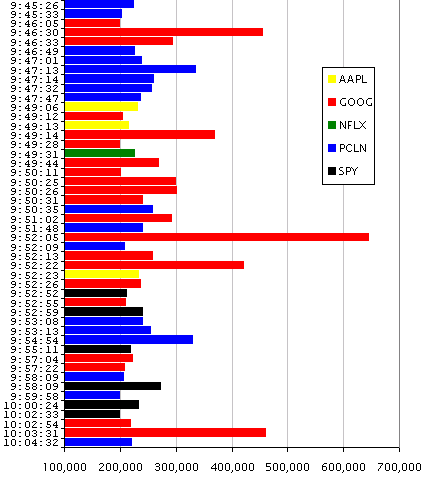
On October 23, 2013, the number of Google option quotes in 1 second exceeded 600,000.
This happened twice in a 30 minute period, at 9:34:03 and 9:52:05. The charts below
show all instances where option quotes from one symbol exceeded
200,000 in one second.
We will examine the impact of these high quote events in more detail.
1. Instances of 200,000 or more option quotes in 1 stock in 1 second.
Option data is sent on 48 multicast lines. Think of each one as a separate network.
OPRA (The Option Pricing Authority) divides these lines up by Option Symbol according
to the table below. Each multicast line has an absolute limit for the number of quotes
and trades sent each millisecond. When this limit is reached, all quotes and trades
for that line will queue. Therefore if a high number of quotes from Google (GOOG - line
18) causes the line to hit that limit, not only will Google option quotes and trades
be delayed, but quotes and trades for all symbols on line 18 will be delayed, such as
all GLD puts.
Note that some symbols - Apple (AAPL), GLD and SPY are so active, that they require
2 multicast lines - one for calls and one for puts.
| L# | From | Through |
L# | From | Through |
L# | From | Through |
L# | From | Through |
| 1 | A | AAPL Calls | 13 | DK | EEMZ | 25 | KM | LTZZ | 37 | SI | SPDZ |
| 2 | AAPL Puts | ADHZ | 14 | EEN | EUQZ | 26 | LU | MDYZ | 38 | SPE | SPY Calls |
| 3 | ADI | AKLZ | 15 | EUR | FAZZ | 27 | MDZ | MNXZ | 39 | SPY Puts | SRRZ |
| 4 | AKM | AMZZ | 16 | FB | FTZZ | 28 | MNY | MVZZ | 40 | SRS | TAZZ |
| 5 | AN | AXMZ | 17 | FU | GLD Calls | 29 | MW | NEZZ | 41 | TB | TMZZ |
| 6 | AXN | BGZZ | 18 | GLD Puts | GOOZ | 30 | NF | NXZZ | 42 | TN | TZZZ |
| 7 | BH | BTZZ | 19 | GOP | HNZZ | 31 | NY | PAZZ | 43 | U | UXZZ |
| 8 | BU | CEZZ | 20 | HO | IDZZ | 32 | PB | PLZZ | 44 | UY | VSZZ |
| 9 | CF | CMZZ | 21 | IE | IWLZ | 33 | PM | QKZZ | 45 | VT | WFSZ |
| 10 | CN | CSCZ | 22 | IWM | IWMZ | 34 | QL | RCZZ | 46 | WFT | XKZZ |
| 11 | CSD | DEZZ | 23 | IWN | JNMZ | 35 | RD | RUSZ | 47 | XL | XLSZ |
| 12 | DF | DJZZ | 24 | JNN | KLZZ | 36 | RUT | SHZZ | 48 | XLT | ZZZZ |
Google options are sent on OPRA line 18 (light blue) and PCLN on line 32 (light Green).
When we plot the peak millisecond count for each line over long periods of time (minutes)
we can see where and when hard limits appear. On October 23, 2013, lines 18 and 32 hit
that hard limit which appeared at 1 million quotes per second (1,000 per millisecond).
Those limits were hit at least once every 30 seconds!
2. Chart of peak millisecond message rates for each of the 48 OPRA lines between
9:30 and 10:05 on October 23, 2013
Let's take a closer look at the data from the chart above. Each chart below shows a
5 second period of time. One horizontal pixel represents 5 milliseconds of time. Watch what happens when an individual color spike high - the line quickly reaches a peak, and then stays there for a period of time. This is when data on that line is being
queued (delayed). The longer it stays at the peak, the longer the delay.
The first 11 charts show the five second period when a symbol exceeded 400,000 in a second (from chart 1). Only Google (line 18, light blue in charts below) and Priceline (line 32, light green) exceeded these rates on October 23, 2013 between 9:30 and 10:05.
The rest of the charts show each 5 second period of time between 9:30 and 10:05 in order.
3. Charts of peak millisecond message rates for each of the 48 OPRA lines over
5 second periods between 9:30 and 10:05 on October 23, 2013
Nanex Research
Inquiries: pr@nanex.net