Nanex Research

Nanex 13-May-2014 ~ 15:49:41 Flash Crash Event
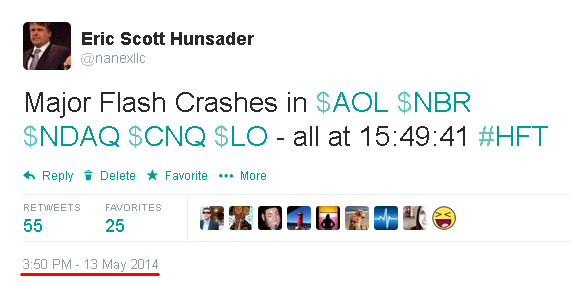
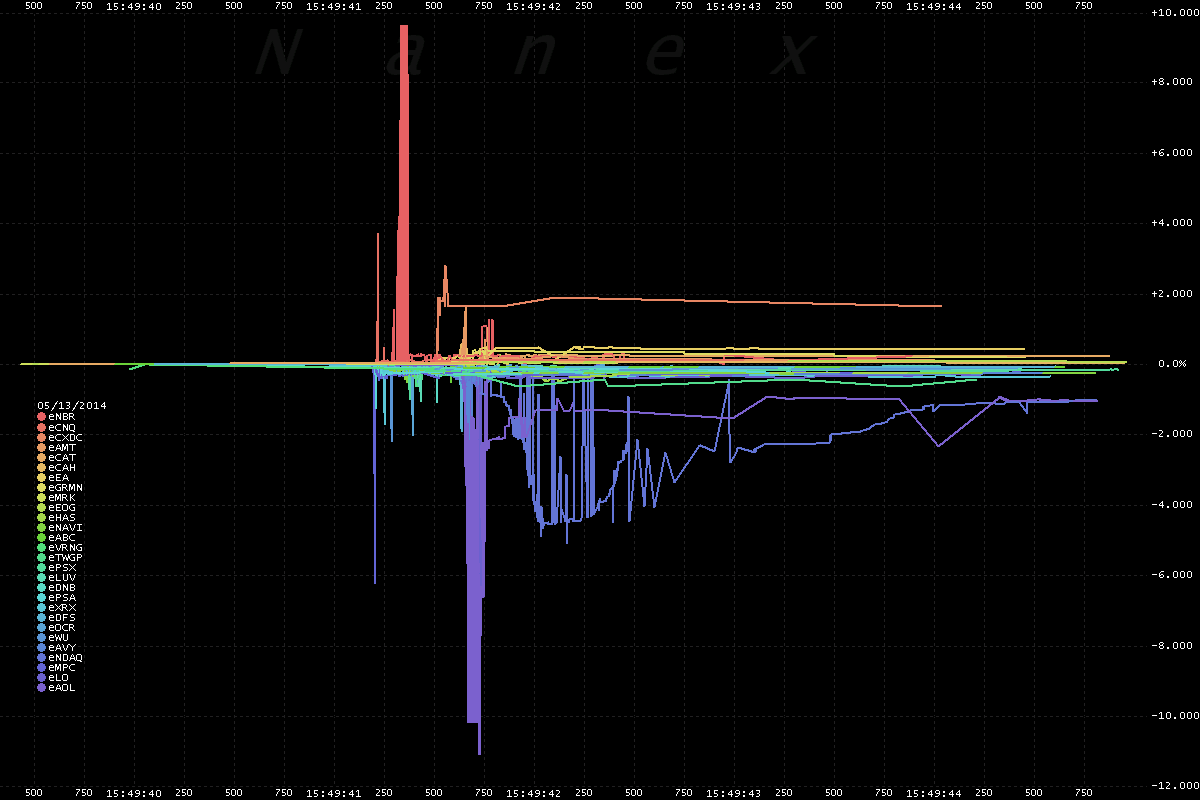
On May 13, 2014 at 15:49:41, at least 28 stocks suddenly jumped or dropped
in price
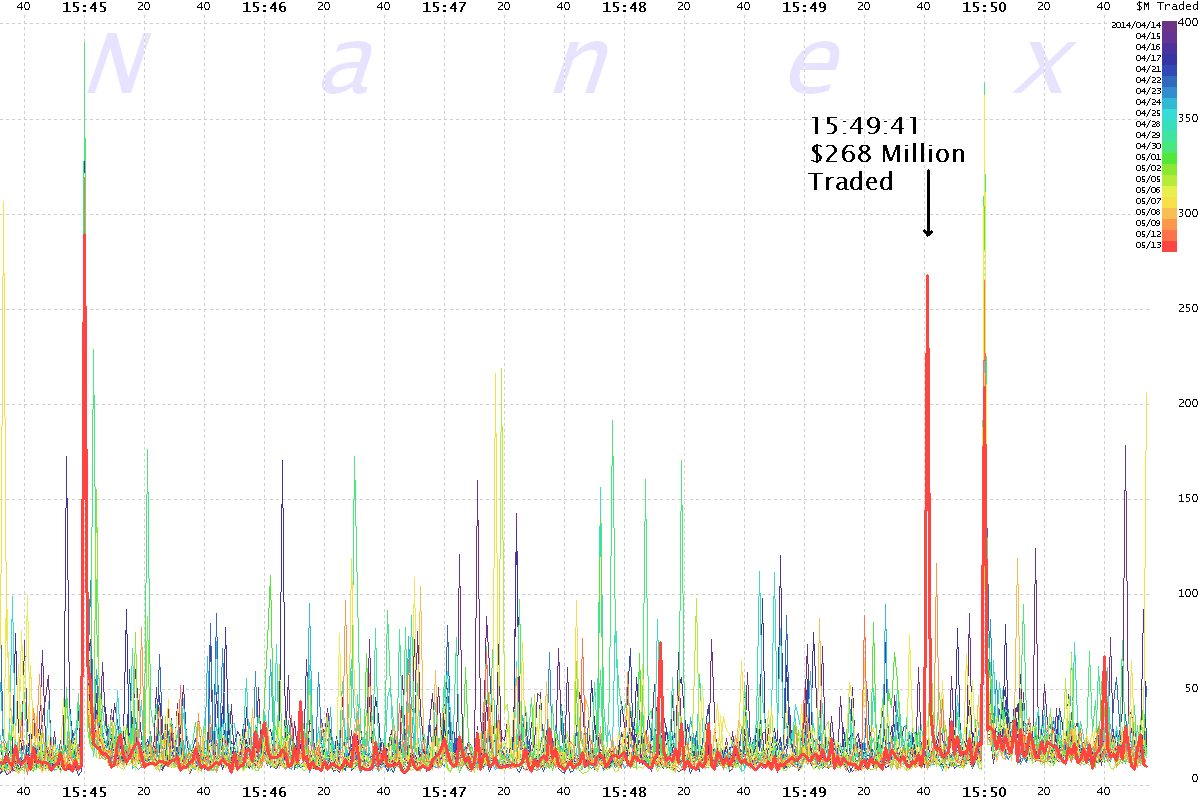
while 99 stocks had 50 or more trades during the one second period. During the same
one second, $268 million worth of NMS stocks traded. Chart 2 below
puts this in perspective.
List of 28 affected stocks with high activity and significant price movement during
this event (trade count and percent
change corresponding to a several second period):
| Symbol |
#Trades |
%Change |
 |
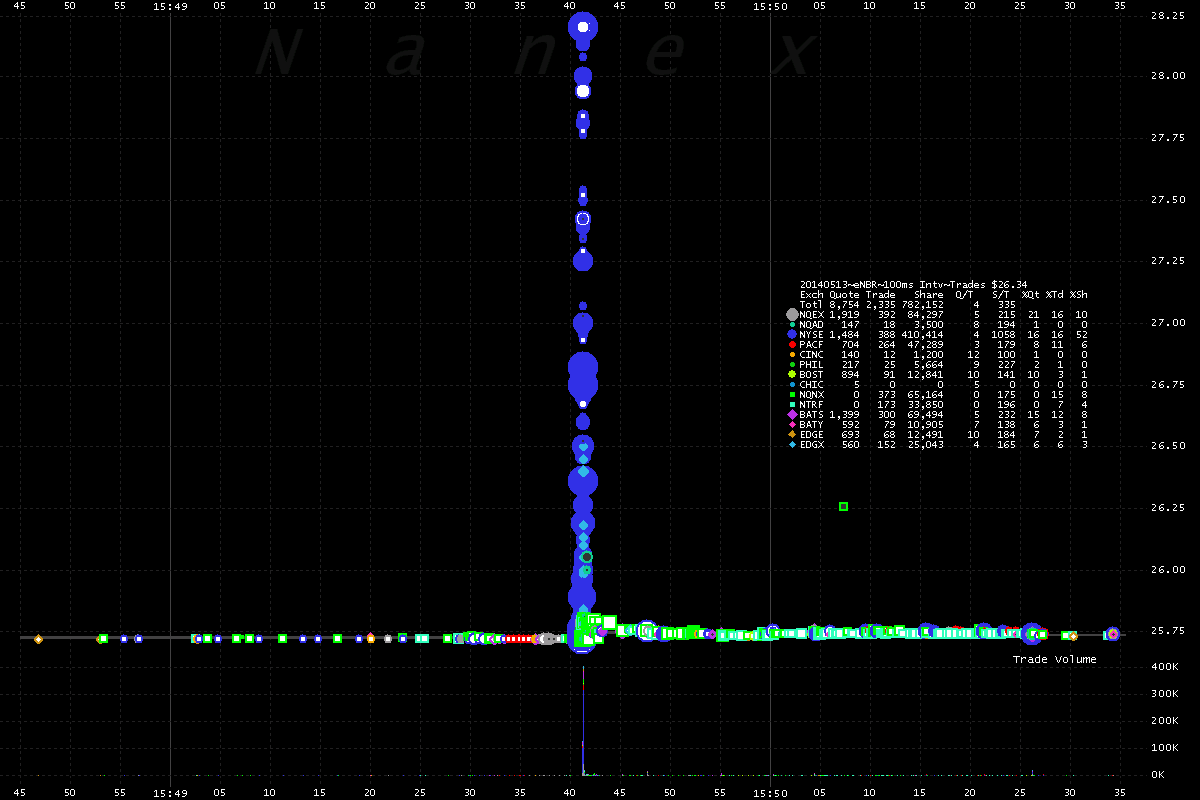
| NBR | 1306 | 9.64% |
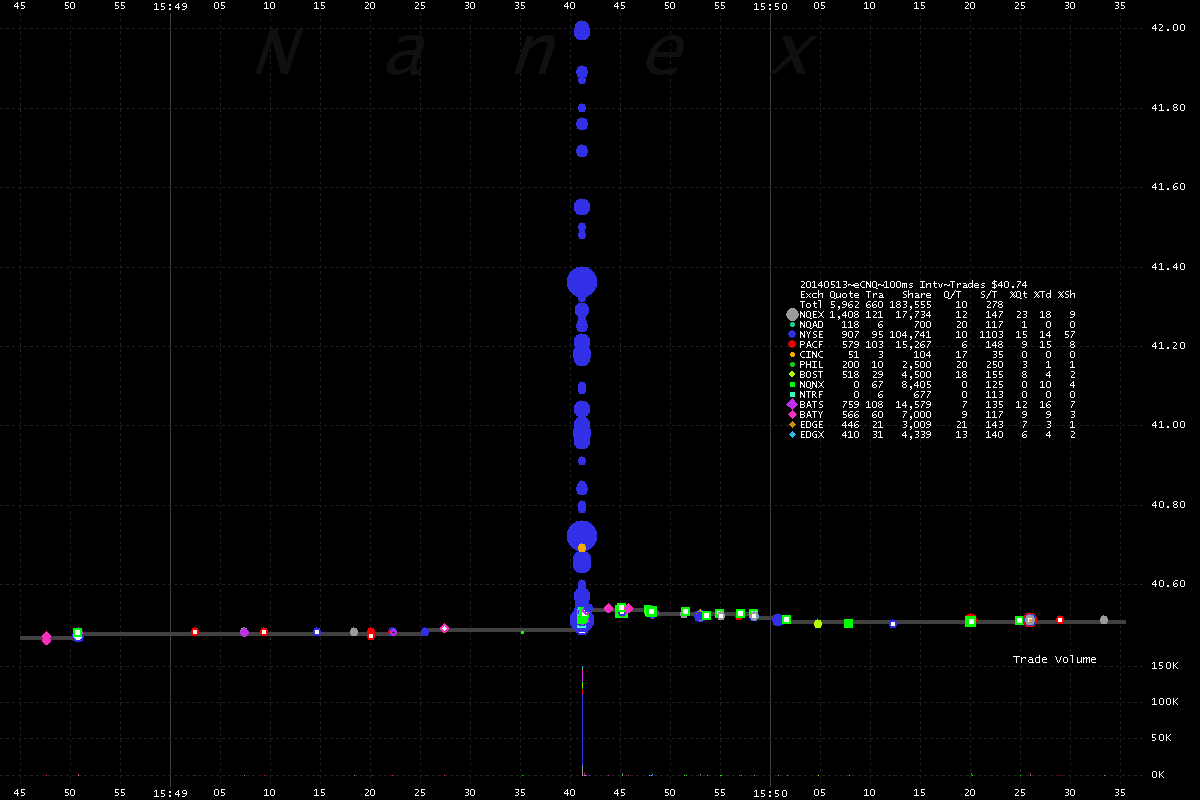
| CNQ | 475 | 3.73% |
| CXDC | 73 | 2.80% |
| AMT | 331 | 1.61% |
| CAT | 668 | 1.04% |
| CAH | 333 | 0.58% |
| EA | 525 | 0.50% |
| GRMN | 335 | 0.42% |
| MRK | 354 | 0.39% |
| EOG | 147 | 0.33% |
| HAS | 442 | -0.49% |
| NAVI | 169 | -0.50% |
| ABC | 163 | -0.52% |
| VRNG | 99 | -0.63% |
| TWGP | 69 | -0.63% |
| PSX | 362 | -0.98% |
| LUV | 464 | -1.06% |
| DNB | 110 | -1.09% |
| PSA | 214 | -1.24% |
| XRX | 786 | -1.69% |
| DFS | 404 | -1.91% |
| OCR | 316 | -2.02% |
| WU | 565 | -2.20% |
| AVY | 339 | -3.13% |
| NDAQ | 1423 | -5.09% |
| MPC | 512 | -6.21% |
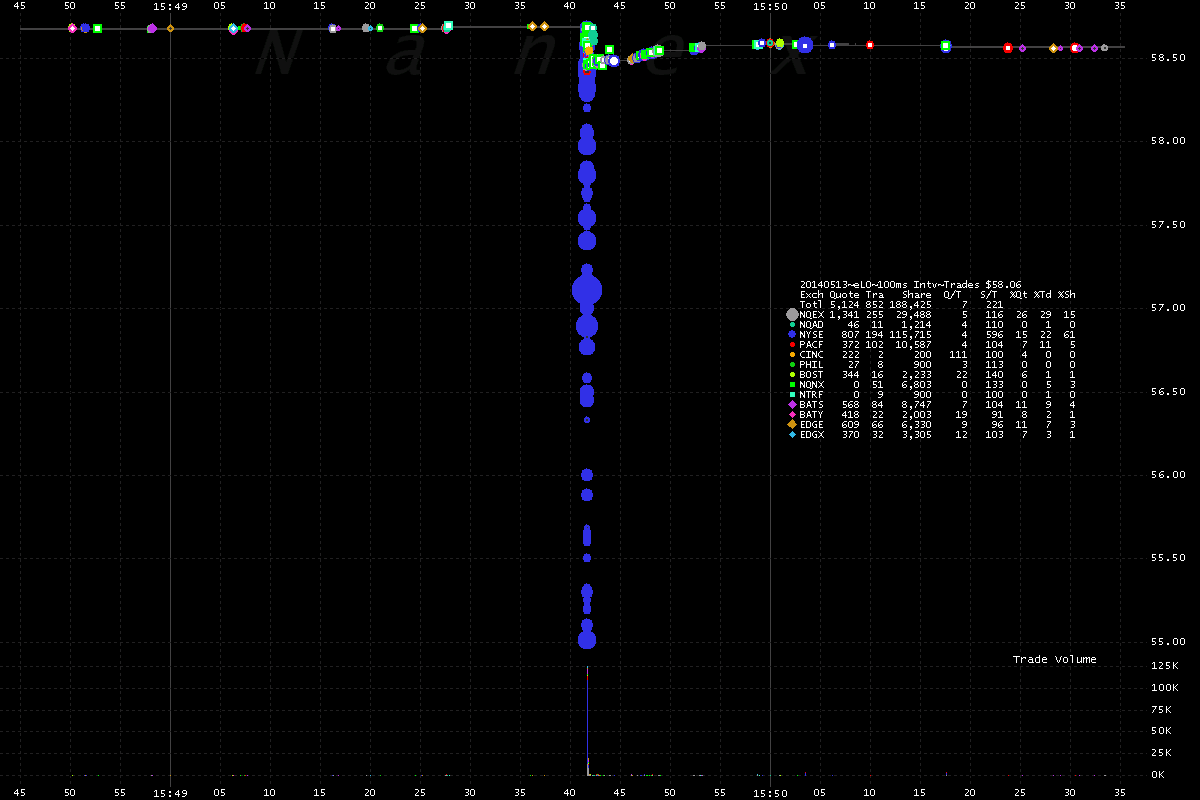
| LO | 581 | -6.29% |
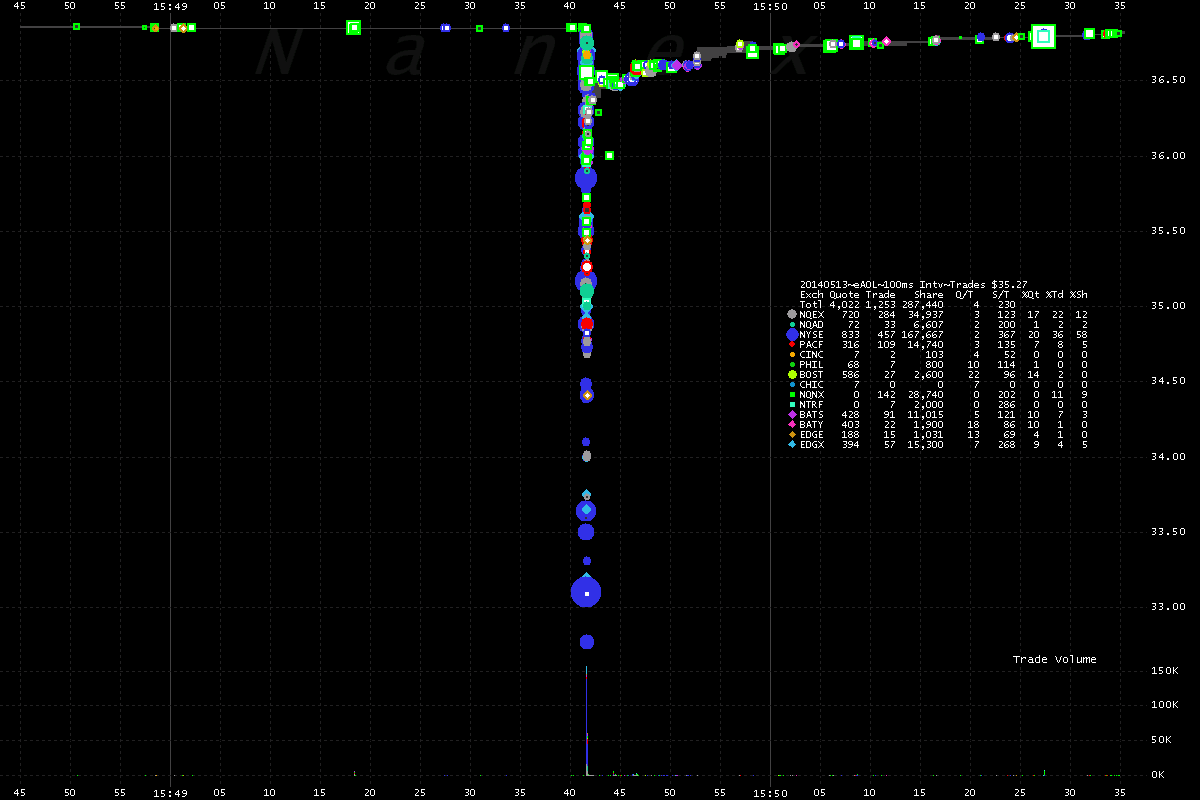
| AOL | 861 | -11.07% |
1.The 28 Stocks listed above.
Note that the stocks that went up in price started about 1/2 second before the stocks
that dropped in price moved.
2. Value of NMS Stocks traded each second for each day over the last month (in $ millions).
The thick red line is May 13, 2014.
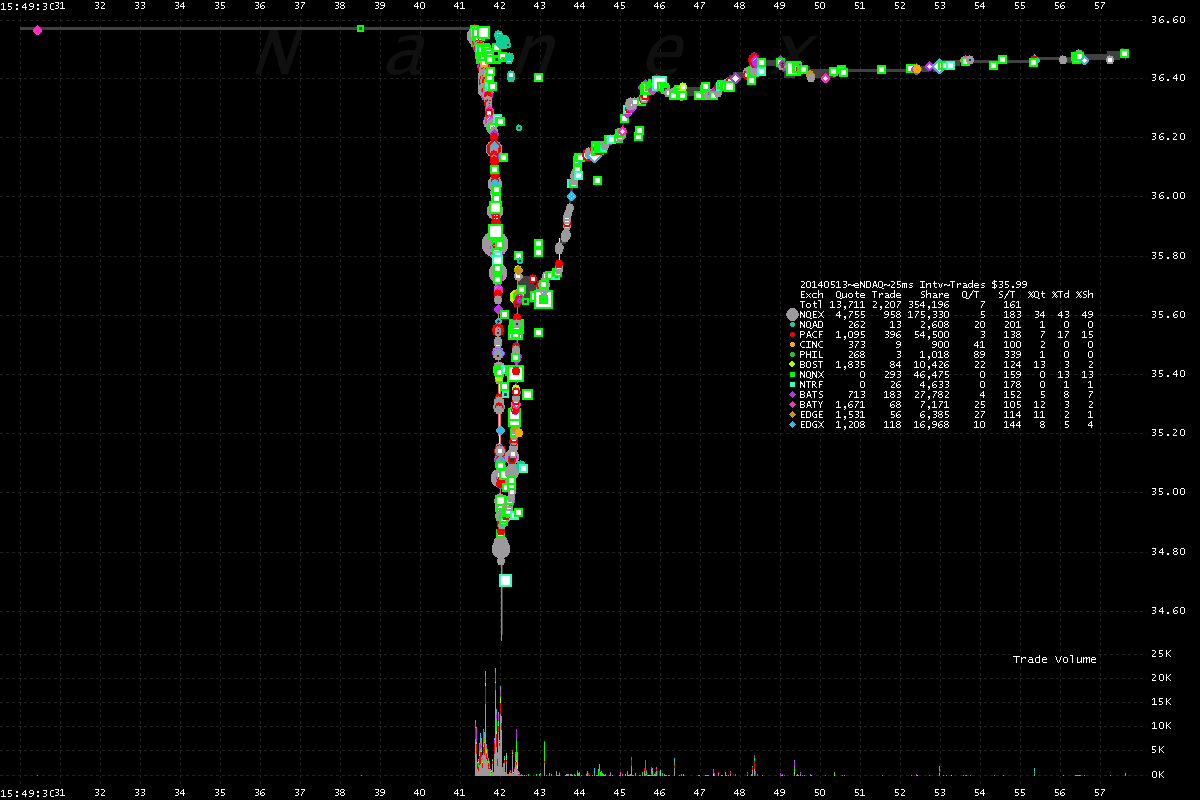
3. NDAQ.
4. AOL.
5. CNQ.
6. LO.
7. NBR.
Nanex Research
Inquiries: pr@nanex.net


