On July 13, 2015, the U.S. Department of Treasury, the Board of Governors of the Federal Reserve System, the Federal Reserve Bank of New York, the U.S. Securities and Exchange Commission, and the U.S. Commodity Futures Trading Commission released a joint report analyzing the significant volatility in the U.S. Treasury market on October 15, 2014 (press release, paper [pdf]). We'll simply call it the "Fed Paper".
For reference, we published two pages of our findings and charts shortly after the event: Treasury Flash Crash, and Treasury Flash Crash Update.
As an expert in the field of forensic investigation in market structure events, we've been in regular contact with government and monetary agencies world-wide over the Treasury Flash Crash Event, the Federal Reserve was no exception.
This paper highlights key findings in the Fed Paper.
We aren't sure why this was done. The paper has only one reference to HFT in a foot note at the bottom of page 13:
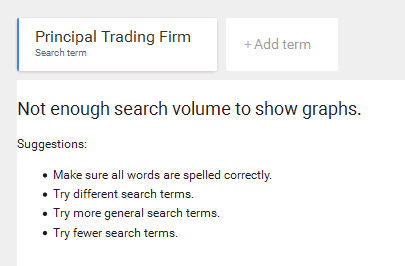
We do know that the term PTF did not exist as recently as one month ago, in the Fed paper or elsewhere. Google doesn't know about it:
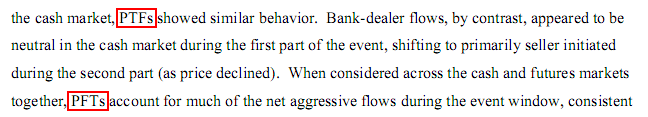
We suspect someone replaced every instance of "HFT" with "PTF", and that PTF was chosen because it consumes the same space in the variable width font used in the paper's text, tables, and charts. The following section of text was probably added after the search/replace because it swaps two letters:
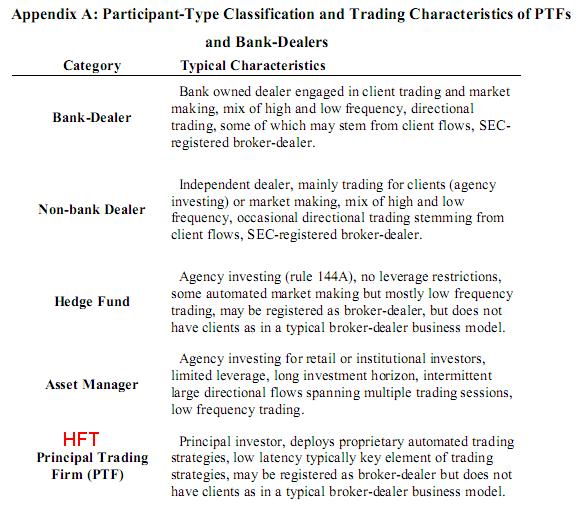
Appendix A in the Fed Paper shows the firm classifications used. As you can see, the "Typical Characteristics" for PTF matches what the rest of the industry calls HFT. Here's our definition of HFT.
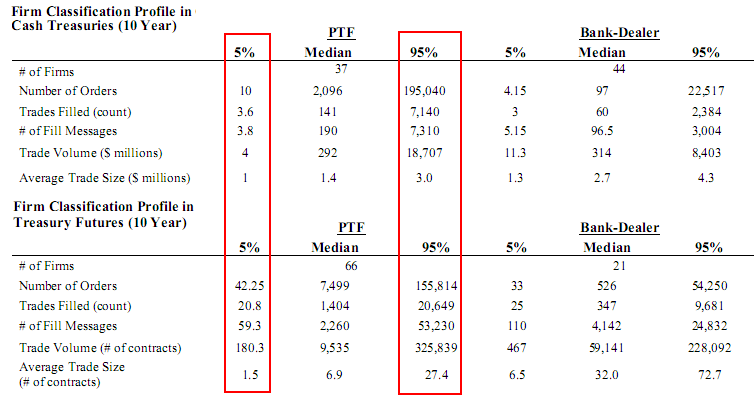
The Fed Paper goes on to compare the trading profiles for PTF's with Bank-Dealers, probably in an attempt to justify the use of a new term using a table full of numbers. However if we simply look at the vast difference between the 5% and 95% numbers for PTF (HFT) - see red boxes below - it becomes evident to us, that PTF was probably invented by a lobbyist, not someone concerned with data integrity or intellectual honesty:
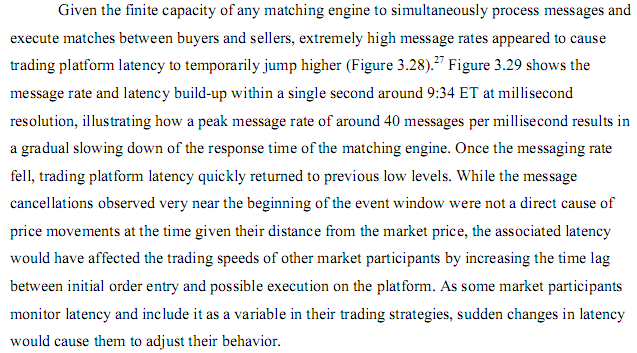
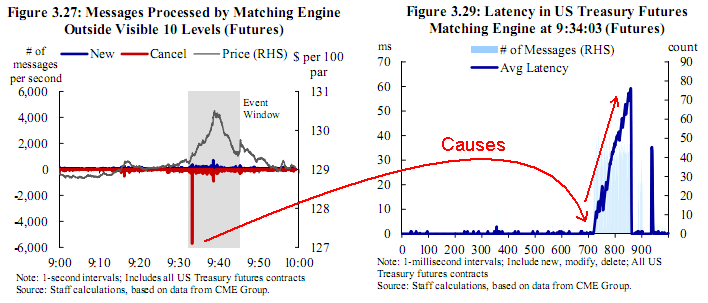
The Fed Paper found that message rates as low as 40 messages per millisecond (40,000/second) would cause a delay in the CME matching engine for the 10 year Treasury Futures on October 15, 2014.
Here's a chart of the quote stuffing event and the resulting CME Matching Engine latency. Note that only a few microsecond are needed by a firm to gain an edge over other participants. This event was probably chosen because it's a nice illustration of the effect one firm can have on the rest of the market.
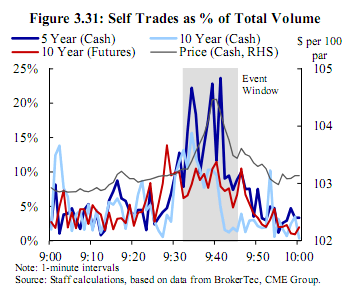
One of the most shocking findings in the Fed Paper is the amount of wash trading discovered. Not only in the cash markets (where it might be legal), but also in the futures market (where it is certainly not legal). The figure below shows the amount of wash trading (called Self Trades - another new, odd, lobbyist-like term) in the Futures and Cash Treasury markets. The red line indicates illegal activity: it should be flat. It is very disturbing to see wash trading rise significantly during the crash event. Wash trades could easily be used in times of stress to walk prices higher or lower, by simply buying from yourself at higher or lower prices (which is one of the many reasons it's illegal).
The red line indicates illegal activity.
Perhaps more troubling than the wash trading itself: the regulator's reaction after discovering it. It's not often a regulatory agency finds blatant illegal activity with audit trail data: which means the regulator already knows the exact identities of the guilty parties. While there still may be fines over this behavior yet to come, the regulators response is alarming. How many participants might think wash trading might be worth the "regulatory risk" after reading this?
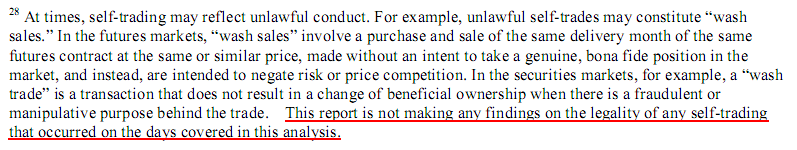
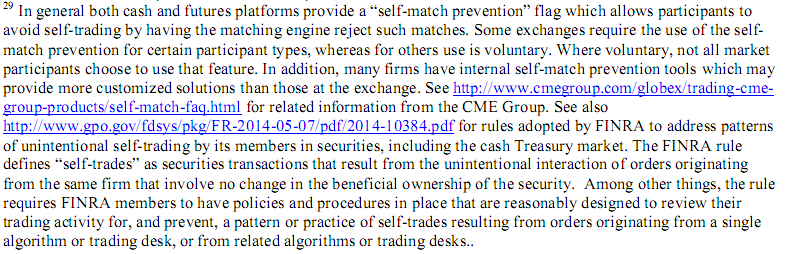
Even more disturbing is the attempt at fooling the reader into thinking wash trading may not be illegal. For example, the use of the term "voluntary" in the footnote shown below.
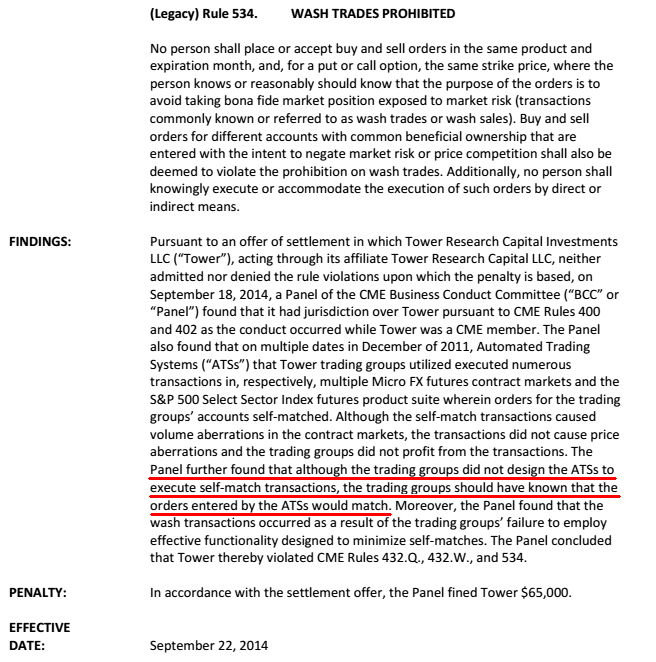
To be clear, the CME provides a mechanism that firms can "optionally use" to ensure they aren't wash trading. This doesn't mean the legality of wash trading is optional: it simply means that firms opting out of CME's self-match prevention are certifying that they have better tools in place to ensure this illegal activity doesn't occur, even accidentally: a point made clear in CME's fine against Tower Trading.
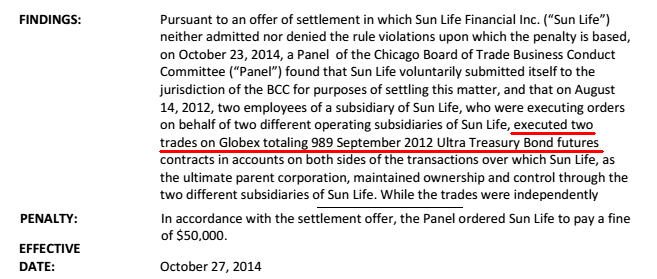
Note how just 2 wash trades in Treasury Futures resulted in a $50,000 fine (also note the effective date):
It is rare to find a set of charts that so clearly illustrate a complex event. Using 6 charts from the Fed Paper, we can show you what caused the October 15 Treasury Event.
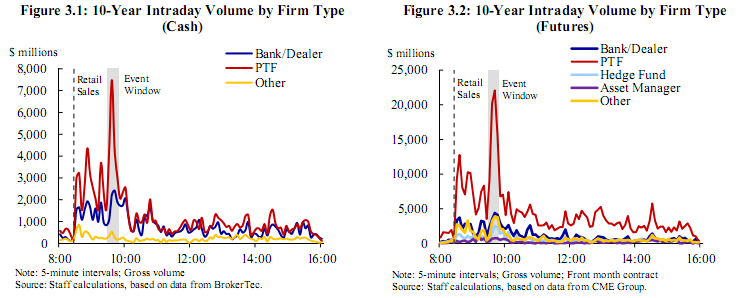
The first two images show trading volume by firm type. Look closely at the red line: it shows the trading volume executed by PTFs (HFTs). Note the spike during the event window (the narrow vertical gray bar). No other firm type shows such a dramatic increase in trading volume (not only during the event, but elsewhere in the day). About an hour before the event, there was a major economic news release (8:30) which provides a nice comparison: it allows us to see just how outsized the volume during the event window is. (see also these charts we posted).
What these two charts tell us: HFT began trading at a sharply higher rate during the event. No other firm type had a significant or even mentionable increase in trading activity. That leads to the question: who were the HFTs trading against? The next set of charts will give us that answer.
Only one firm type had a significant volume spike during the event: HFT (PTF - red line)
The set of 4 charts below breaks down trading volume during the event by firm type and whether the trade is passive or aggressive.
The top 2 charts below show aggressive volume for Cash (3.5 left top) and Futures (3.6 right top), while the bottom 2 charts show passive volume for Cash (3.7 left bottom) and Futures (3.8 right bottom). An aggressive trade is one that executes against a resting order and can therefore move prices. A passive trade is a resting order that executes against an active order and will therefore dampen price moves. Aggressive trades remove liquidity, while passive trades provide liquidity.
When Net Aggressive Volume is trending up (top 2 charts), it means that there is more aggressive buying than aggressive selling, which in the absence of liquidity, would push prices higher. When Net Aggressive Volume is trending down, it means there is more aggressive selling than aggressive buying, which, in the absence of liquidity, would push prices down.
When Net Passive Volume is trending down (bottom 2 charts), it means there are more passive buy orders than passive sell orders: when trending up, more passive sell orders than buy orders.
Simply put, in the top 2 charts, lines trending higher show who was aggressively buying, while lines trending lower indicate who was aggressively selling.
In the bottom 2 charts: lines trending lower show who was providing liquidity to buyers, while lines trending higher indicate who was providing liquidity to sellers.
Note how the red (PFT/HFT) completely swamps the other firm types in the cash market and is the dominant type in futures. Theses charts clearly show:
HFTs were aggressively buying from other HFTs on the way up, and HFTs were aggressively selling to other HFTs on the way down.
In other words, the Fed Paper uncovers the same hot potato effect in the Treasury market on October 15, 2014, that Andrei Kirilenko found during the Stock Market Flash Crash on May 6, 2010. In both cases, it was HFT algorithms rapidly buying/selling with each other, moving prices to absurd levels and back again.
It doesn't get much clearer than this.