In our original Flash Crash Analysis of May 6'th report, we published findings of HFT sequences and strange algorithmic patterns being sent at very high rates and titled this "Quote Stuffing". In this follow-up report we will show how often these sequences were occurring on the day of May 6'th 2010 and specifically in the minutes leading up to and during the final plunge. We also present rates from other times and for other days, using 3 of our monitoring tools developed while analyzing the flash crash. The monitors consist of the following:
The following charts all display 420 seconds of data (7 minutes, 1 second at a time). Each second contains an accumulated count of the number of stocks exhibiting the desired behavior in that second. We have chosen the timeframe of 14:41 through 14:47. This is the timeframe just prior to the beginning of the final plunge through the time near where the market hit the bottom. Every data point and every chart in this study (in Parts 1, 2 and 3) have been undertaken with identical chart scaling and identical algorithmic detection levels in all study types. The only difference in any one given example is the date and time of the particular study. The count scale is shown on the right and the time scale in minutes at the bottom. As an example if a line representing the BATS exchange is at 25, then 25 stocks had a sequence recorded from BATS during that one second interval. Chart 1 - 08/02/2010. A recent day chosen at random as a reference to the counts we expect to see on any given day. 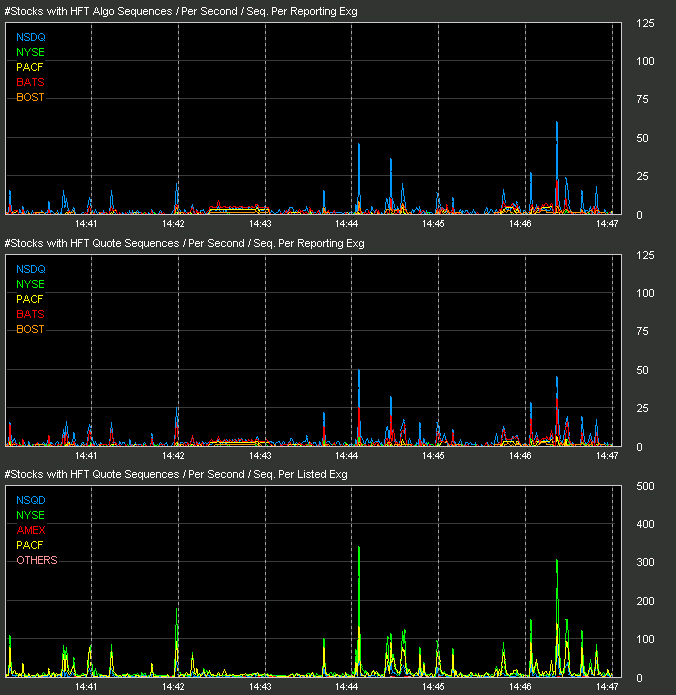 Chart 2 - 05/05/06. The day before the flash crash. Again typical of the counts we see normally on any given day at any given time. 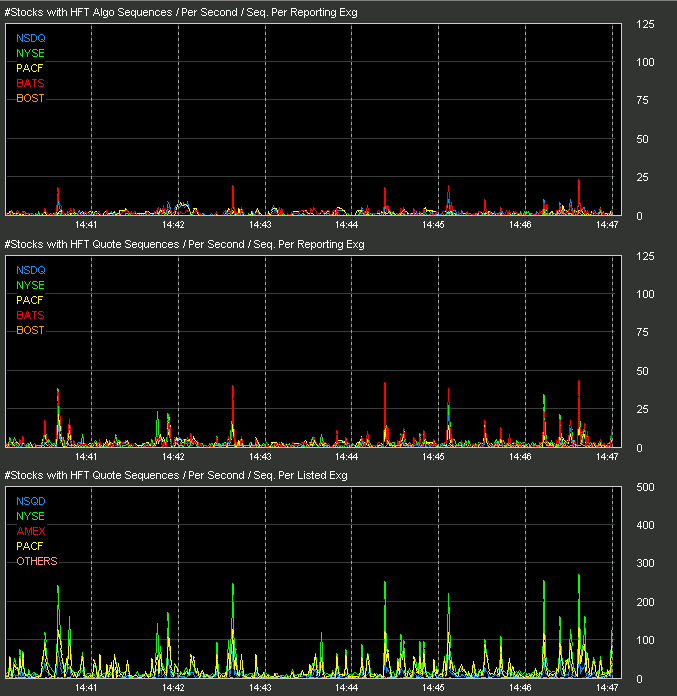 Chart 3 - 05/06/2010. Minutes before and during the flash crash. It is clear from this chart that not only was this activity occurring the day of the flash crash but it was occurring at extremely high rates:  It could be said that these heavy rates reflect the lack of liquidity in the market during this time. We now know that the HFT algo sequences we tend to find the easiest (such as those shown on our Crop Circle of the Day page) happen when little activity is occurring in a stock. As liquidity dried up, these algos went out of control at very high rates in numerous issues (the BATS cancel bot being a prime example). It is this event that we feel started the NYSE to begin sending delayed quotes at approx 14:42. As the delayed NYSE quotes were time stamped as if they were current, HFT's still in the market saw them as fresh and went after the opportunity in latency (latency arbitrage) and rates went even higher, further exaggerating the problem and triggering the final and most drastic plunge of the day. Notice in chart type 3 we see that NYSE listed stocks are the stocks the HFT and HFT Algo sequences are effecting the most, nearly double that of stock listed on other listing exchanges. Continue to Part 2, A Detailed Examination of Sequence Rates on May 6'th, 2010.
|

