Part 2, A Detailed Examination of Sequence Rates on May 6'th, 2010. In Part 1 of this report you saw 3 examples of the HFT monitors for a small slice of time. If you are not yet familiar with Part 1 of the report please take a minute to familiarize yourself with it. In Part 2, we examine 9 slices of time for the day of May 6'th, 2010. The approx. Net Change of the DJI is listed at the beginning and ending time of the particular sequence. Chart 1 - 09:30 - 09:37. Opening bell and first few minutes of the day. DJI NetChg begin: -5 NetChg End: -11 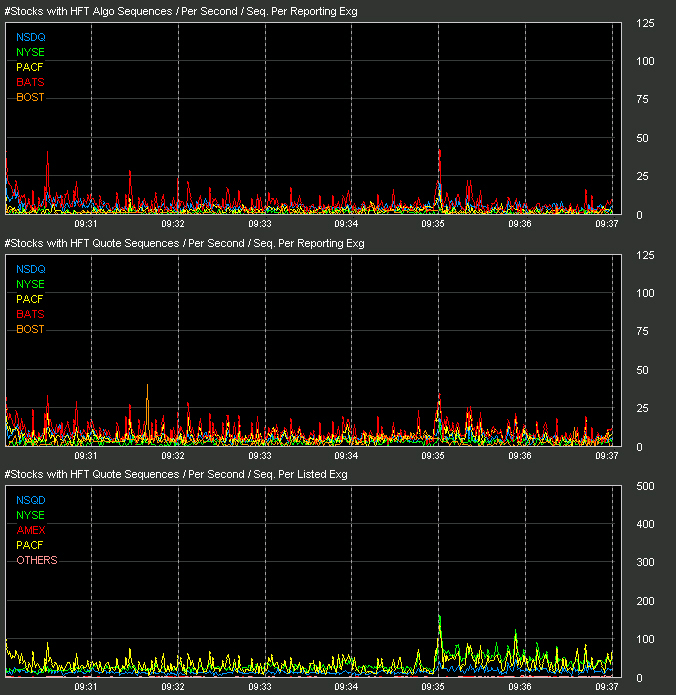 Chart 2 - 13:30 - 13:37. Normal activity. DJI NetChg begin: -113 NetChg End: -135 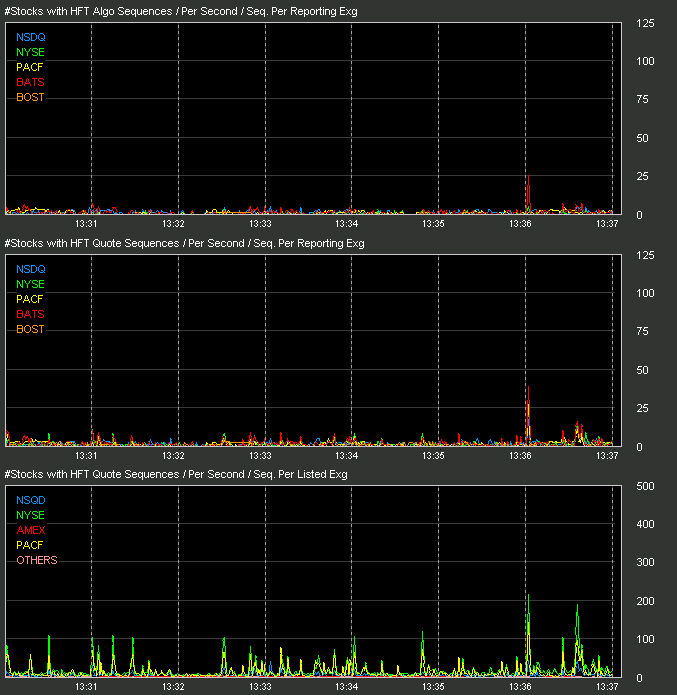 Chart 3 - 14:08 - 14:15 We see the first unusual burst of activity. DJI NetChg begin: -176 NetChg End: -203 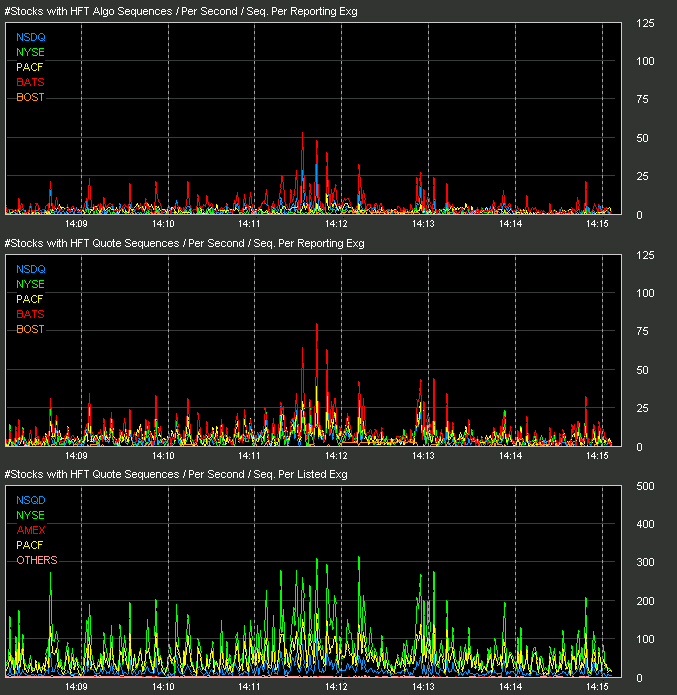 Chart 4 - 14:17 - 14:24 We see another unusual burst at 14-20 - 14:22. DJI NetChg begin: -214 NetChg End: -271 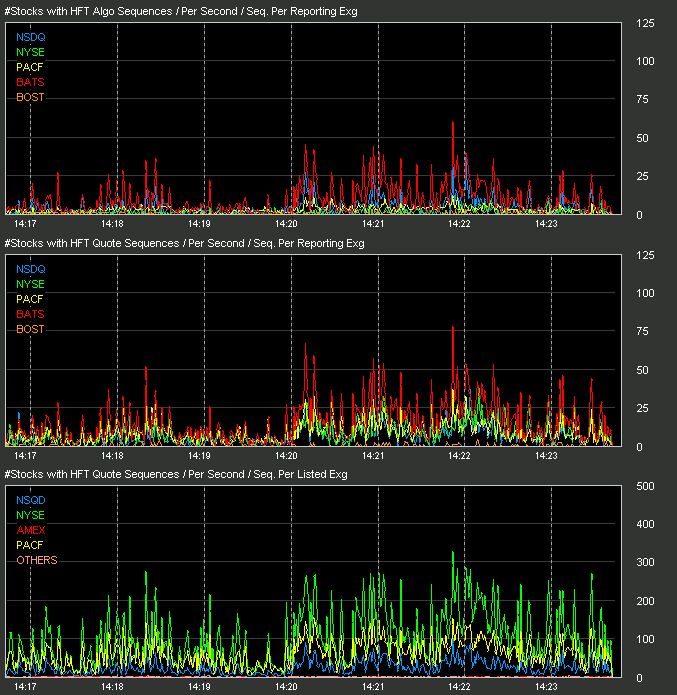 Chart 5 - 14:40 - 14:47 At 14:42:40 we see the start of heavy rates begin. It could be said that these heavy rates reflect the lack of liquidity in the market during this time. We now know that the HFT algo sequences we tend to find the easiest (such as those shown on our Crop Circle of the Day page) happen when little activity is occurring in a stock. As liquidity dried up, these algos went out of control at very high rates in numerous issues (the BATS cancel bot being a prime example). It is this event that we feel started the NYSE to begin sending delayed quotes at approx 14:42. As the delayed NYSE quotes were time stamped as if they were current, HFT's still in the market saw them as fresh and went after the opportunity in latency (latency arbitrage) and rates went even higher, further exaggerating the problem and triggering the final and most drastic plunge of the day. Notice in chart type 3 we see that NYSE listed stocks are the stocks the HFT and HFT Algo sequences are effecting the most, nearly double that of stock listed on other listing exchanges. DJI NetChg 14:40: -407 DJI NetChg 14:41: -415 DJI NetChg 14:42: -412 DJI NetChg 14:43: -459 DJI NetChg 14:44: -548 DJI NetChg 14:45: -665 DJI NetChg 14:46: -828 DJI NetChg 14:47: -981 DJI NetChg 14:48: -886  Chart 6 - 14:45 - 14:52 Activity begin to calm near 14:47. DJI NetChg End: -503 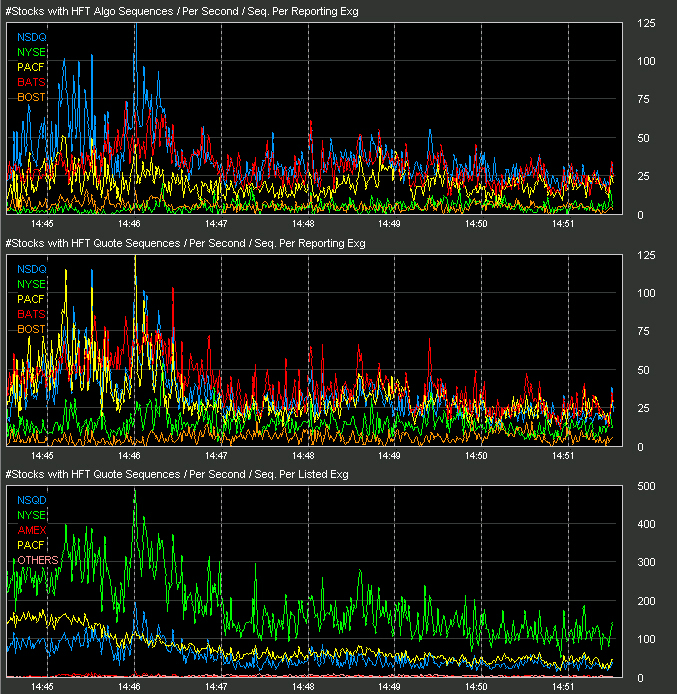 Chart 7 - 14:56 - 15:03 We see another unusual burst of activity near 15:01. DJI NetChg begin: -426 NetChg End: -433 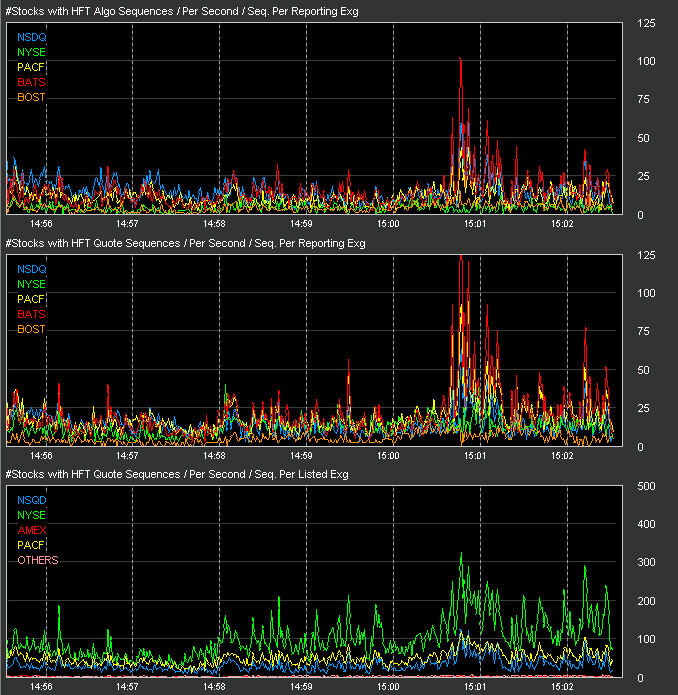 Chart 8 - 15:32 - 15:39 Activity has calmed to near normal levels. DJI NetChg begin: -392 NetChg End: -374 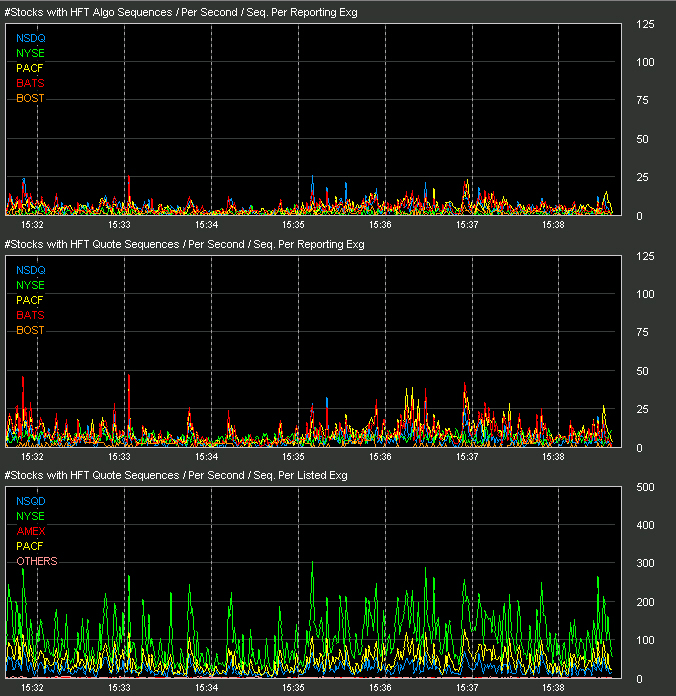 Chart 9 - 15:54 - 16:01 Through the closing bell we see another small burst of activity at 15:57 (common near the close) and then the closing bell. DJI NetChg begin: -282 NetChg End: -350 (may not reflect the official adjusted closing price). 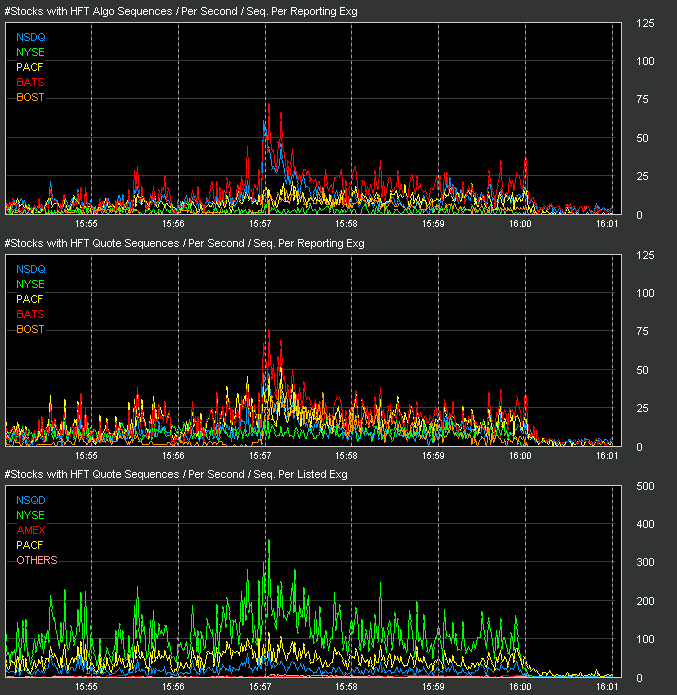 Continue to Part 3, HFT/Algo Sequence Rates, Further Comparisons
|

