How to read charts generated by the Nanex QTSequencer
During our initial investigation of the Flash Crash of May 6'th, 2010, we came across what appeared to be very unusual bursts of quote traffic. On close examination these bursts appeared to have patterns contained in the data. However, because many of the patterns occurred within one second (or even milliseconds), the question arose of how to visualize them. One of the many tools we developed included the Quote-Trade sequencer, an application that charts every quote and trade sequentially with no data loss or compression.
As we continue to use the sequencer on a daily basis to look for strange market phenomena, we have refined the software regularly with new features and more data. Because these charts are not typical, this guide should serve as a reference on how to read them.
Chart
Basics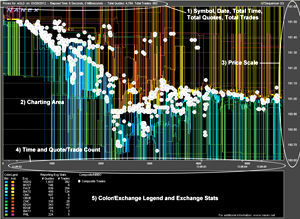 |
Understanding
The Timeline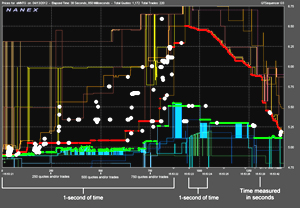 |
How Quotes
are Displayed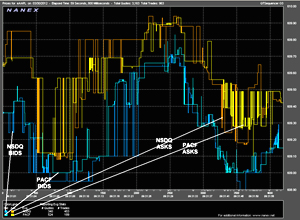 |
How Trades
are Displayed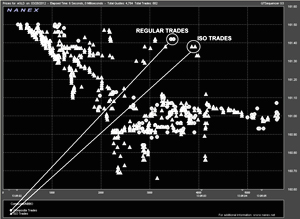 |
Special
Items |
Fine Details |
