Part 3, HFT/Algo Sequence Rates, Further Comparisons In Part 1 of this report you saw 3 examples of the HFT monitors for a small slice of time. In Part 2 you saw 9 slices of time for the day of May 6'th, 2010. If you are not yet familiar with Part 1 and Part 2 of the report please take a minute to familiarize yourself with it. In Part 3, we examine other days at various times for some simple comparisons. With the exception of 05/07/2010 (the day after the flash crash) the days shown here were chosen at random. Chart 1 - 05/06/2010. To Refresh, the HFT/Algo Monitors on 05/06/2010, from 14:40 through 14:47...the "Flash Crash".  Chart 2 - 05/07/2010. Opening bell the morning after the flash crash.  Chart 3 - 05/07/2010. Same time slice at Chart 1 above for the day after the flash crash.  Chart 4 - 08/02/2010. Another normal day. Same time slice at Chart 1 above. 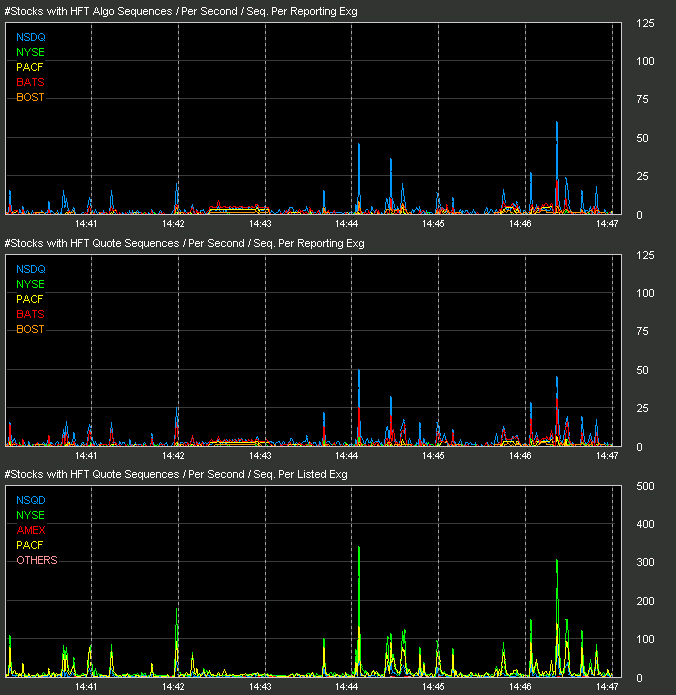 Chart 5 - 04/29/2010. Opening bell. 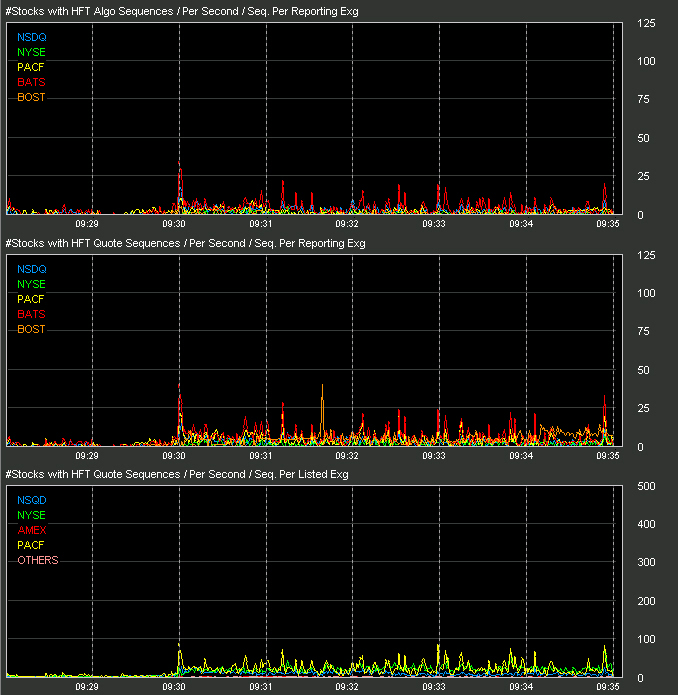 Chart 6 - 01/15/2010. Opening bell. 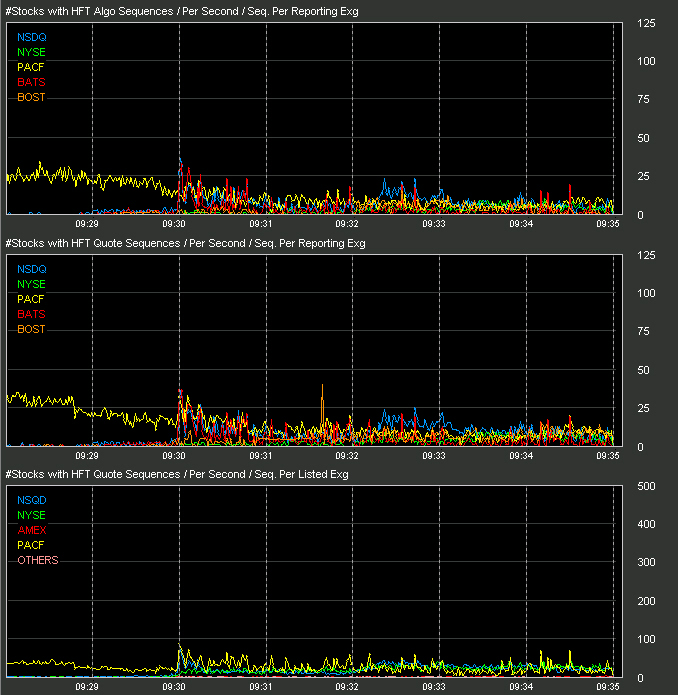 Chart 7 - 05/07/2010. Closing bell. 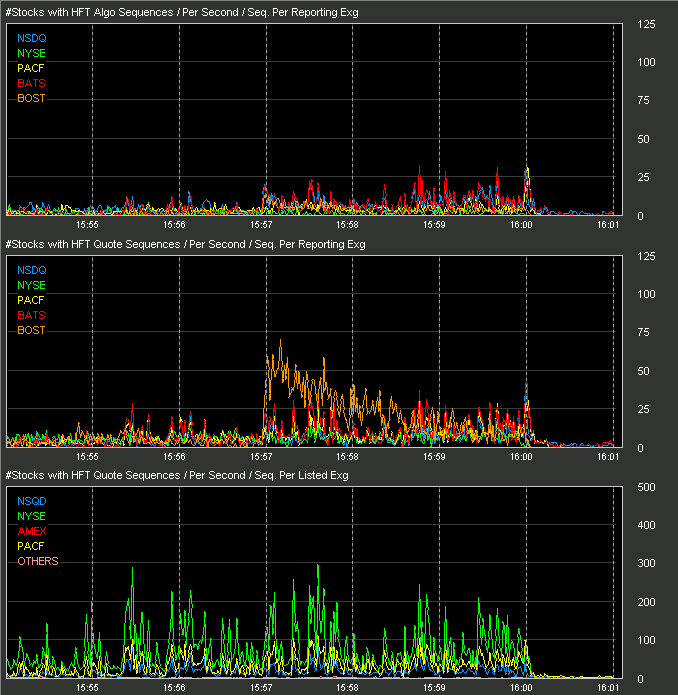 Chart 8 - 08/02/2010. Closing bell. Note the same BOST surge near 15:57 on both 5/7/2010 and 8/2/2010. Possibly we may examine that a bit closer in a later study. 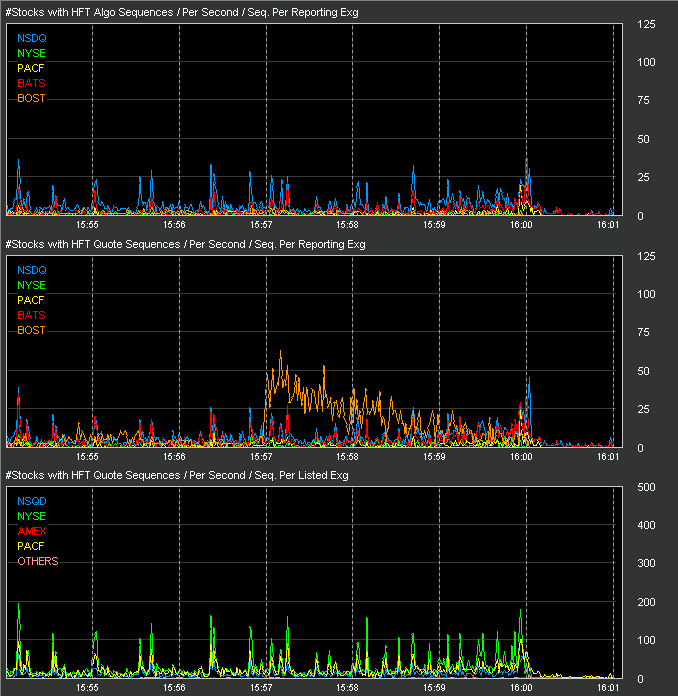 As you can see from this report, HFT's and Algo's were generating quote sequences at extremely high rates in the minutes prior to and during the major plunge on May 6'th. To see how we believe this may have effected the market on 05/06/2010 please refer to our Original Flash Crash Analysis report.
|

